
InnoScout is our research tool: a competitive intelligence and technology scouting platform to get aggregated data and identify key-players, emerging markets, and trends in any industry or technology.
When searching for technical and complex information, being too generic does not help your chances of finding what you are looking for.
Mastering filtering options will allow you to dramatically cut down research time from days to minutes so you can focus on what is really important: your work.
Search Terms allow you to include or exclude keywords from your query. They help you navigate the topic and remain only with the information that is relevant.
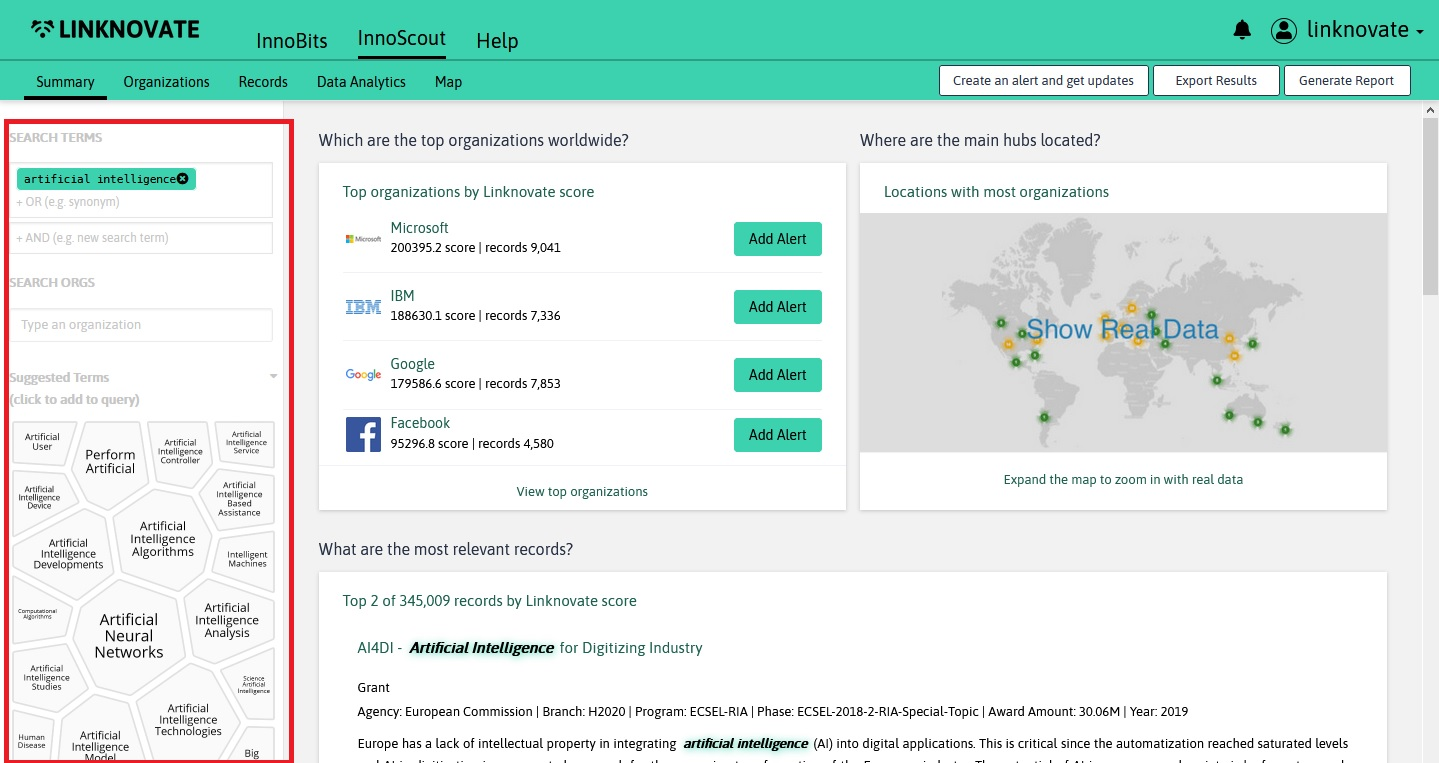
Find the Search Terms fixed on the left of the page, throughout all pages (except for Company Profile pages). They allow you to dig deep in a topic by filtering keywords.
You can use search operators and other punctuation to get more specific search results.
We want to make our website accessible to everyone, so we have developed an interface to help people without experience in scientific search engines perform complex queries.
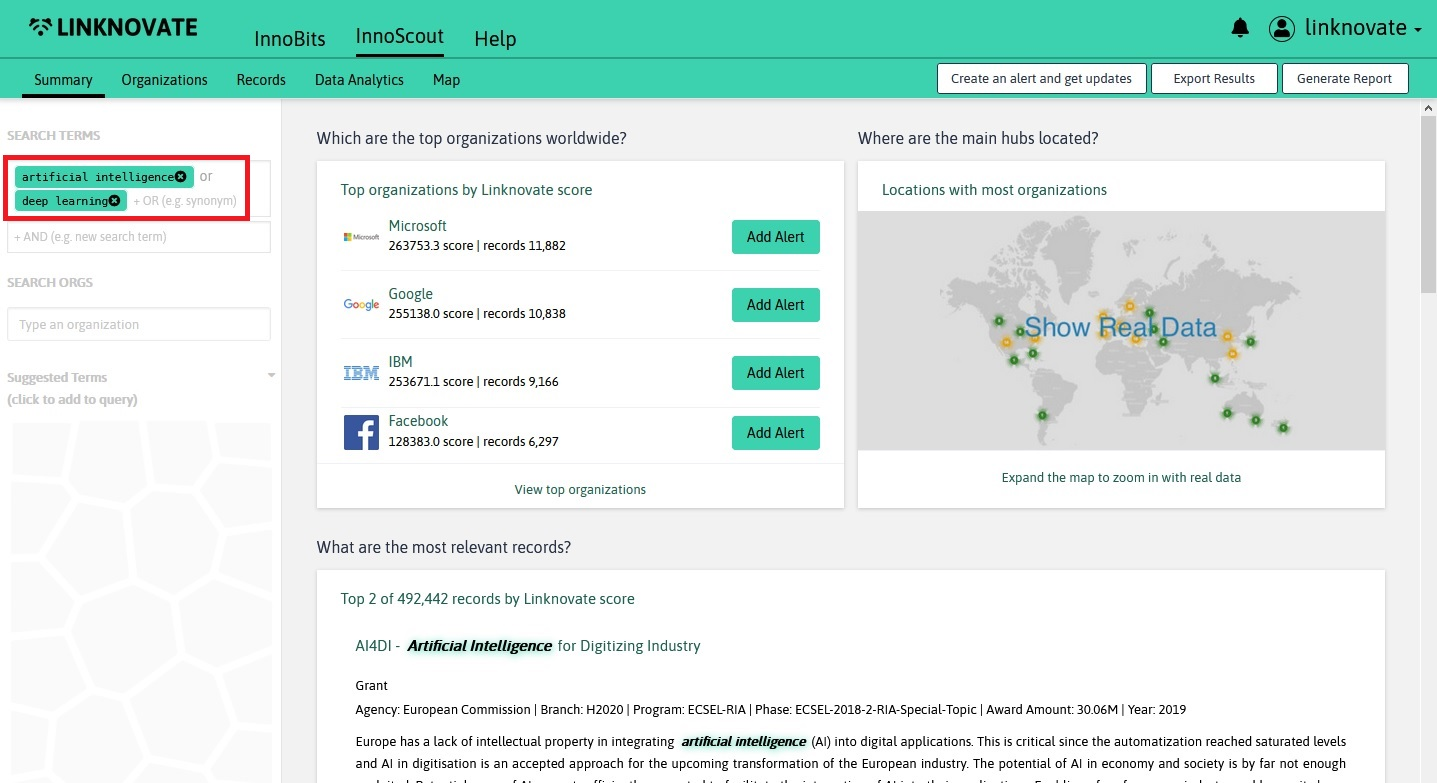
OROperator
Any keyword typed within the same query box is interpreted as an OR operator. This means that our discovery engine will show you all the references & organizations that contain the keyword 1 OR the keyword 2 (a bigger number of references).
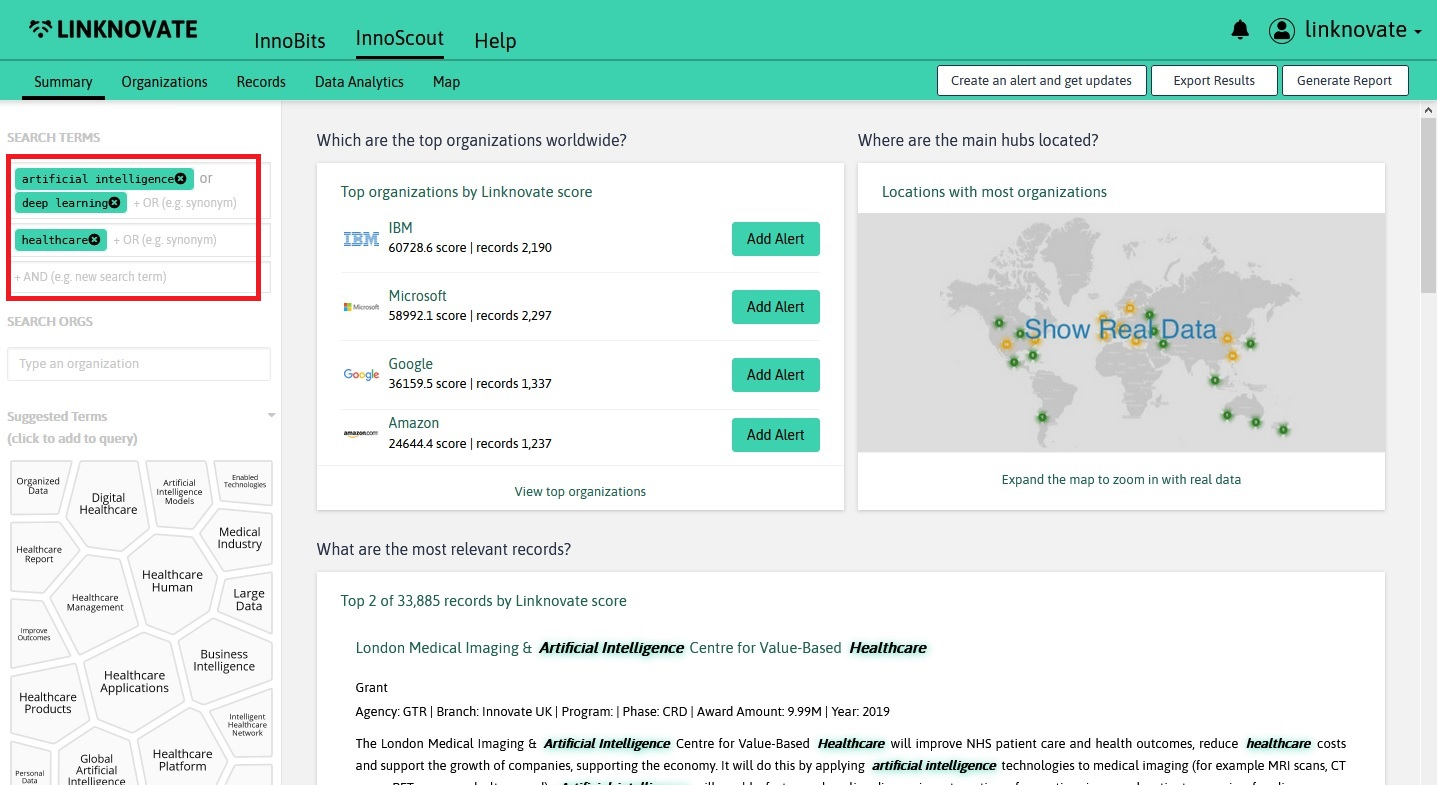
ANDOperator
Any keyword typed in a different query box is interpreted as an AND operator. This means that our discovery engine will show you all the references & organizations that contain the keyword 1 AND the keyword 2 (a smaller number of references).
You can use as many and operators as you like, just type them in new search boxes. New ones will appear as you fill them.
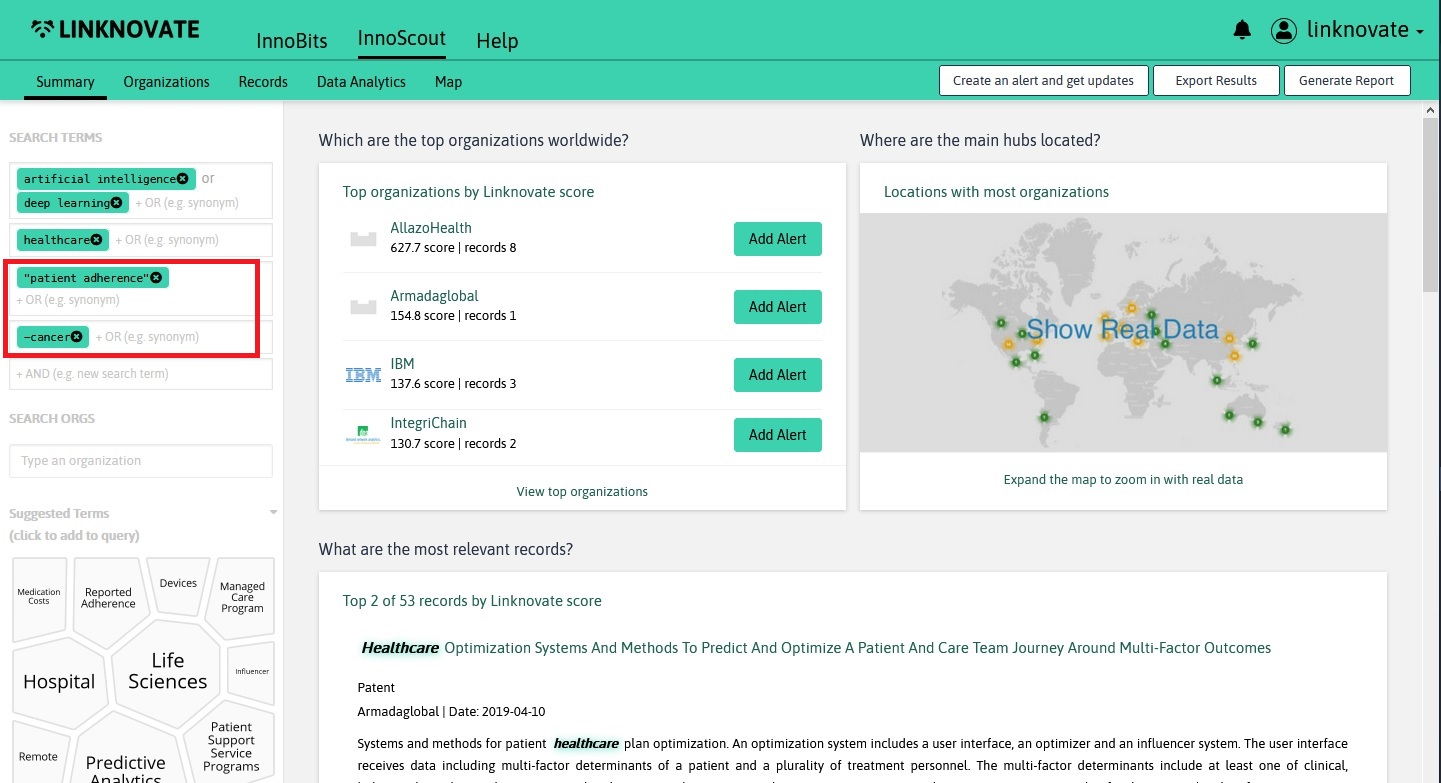
Except for the examples below, Linknovate's Discovery Engine ignores punctuation.
When you use a dash before a keyword, it excludes references with that information from your results. This is useful for words with multiple meanings, for excluding topics that you already know or that you are not interested in.
...) QUOTES
When you type a keyword in quotes, the results will only include references with the same words in the same order as the ones between the quotes (and without any word between them). Use this if you're looking for an exact match of words.
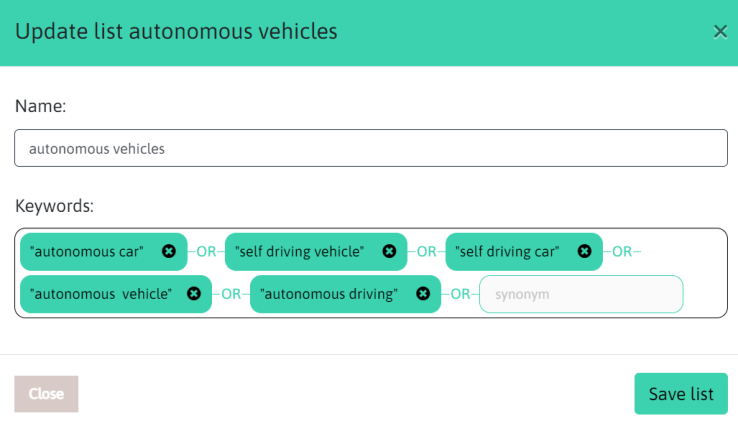
Organization admins can create lists/groups of keywords that you can store and summon up again for future searches.
This feature is convenient if you use a predefined set of search term synonyms repeatedly, for example representing the industry you work in.
The example below is a keyword list for "autonomous vehicles":
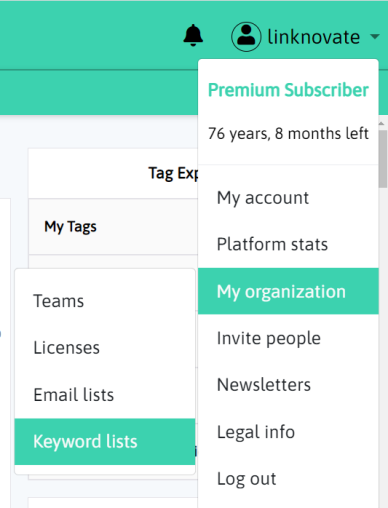
You create your keyword list in your "my organization" area. Click on your name in the upper right of your screen.
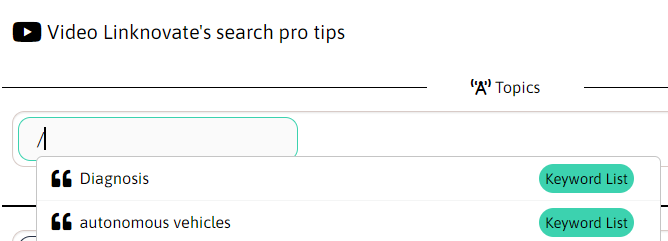
Summon your saved keyword lists again by introducing the slash symbol / into your search term window.
Please note that the keyword list creation is not available to all account access levels. Contact your scouting group admin for further information.
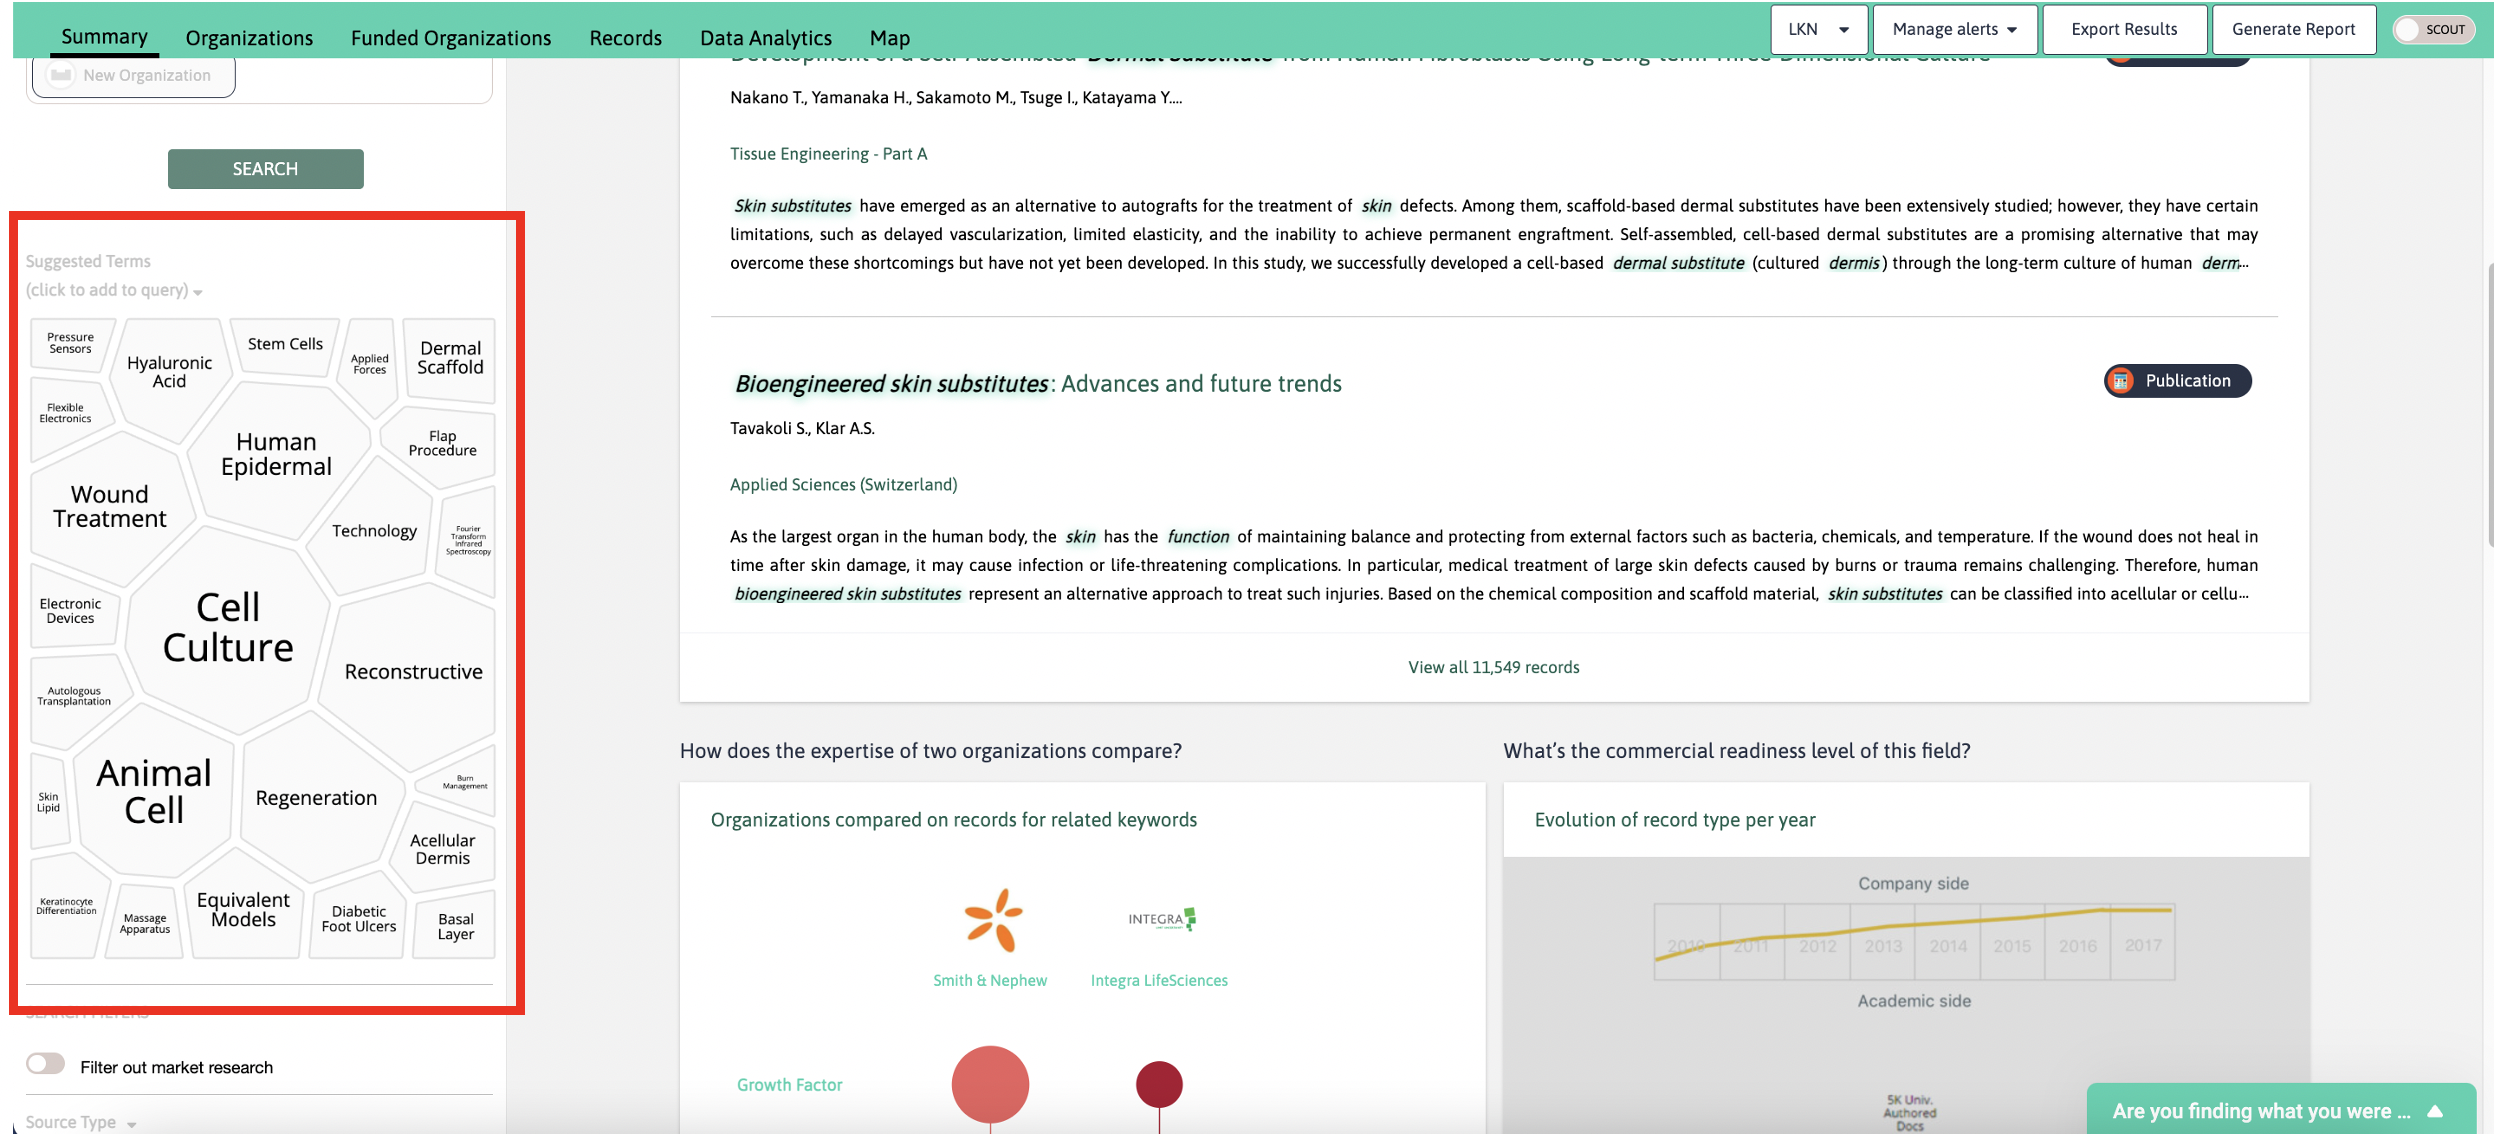
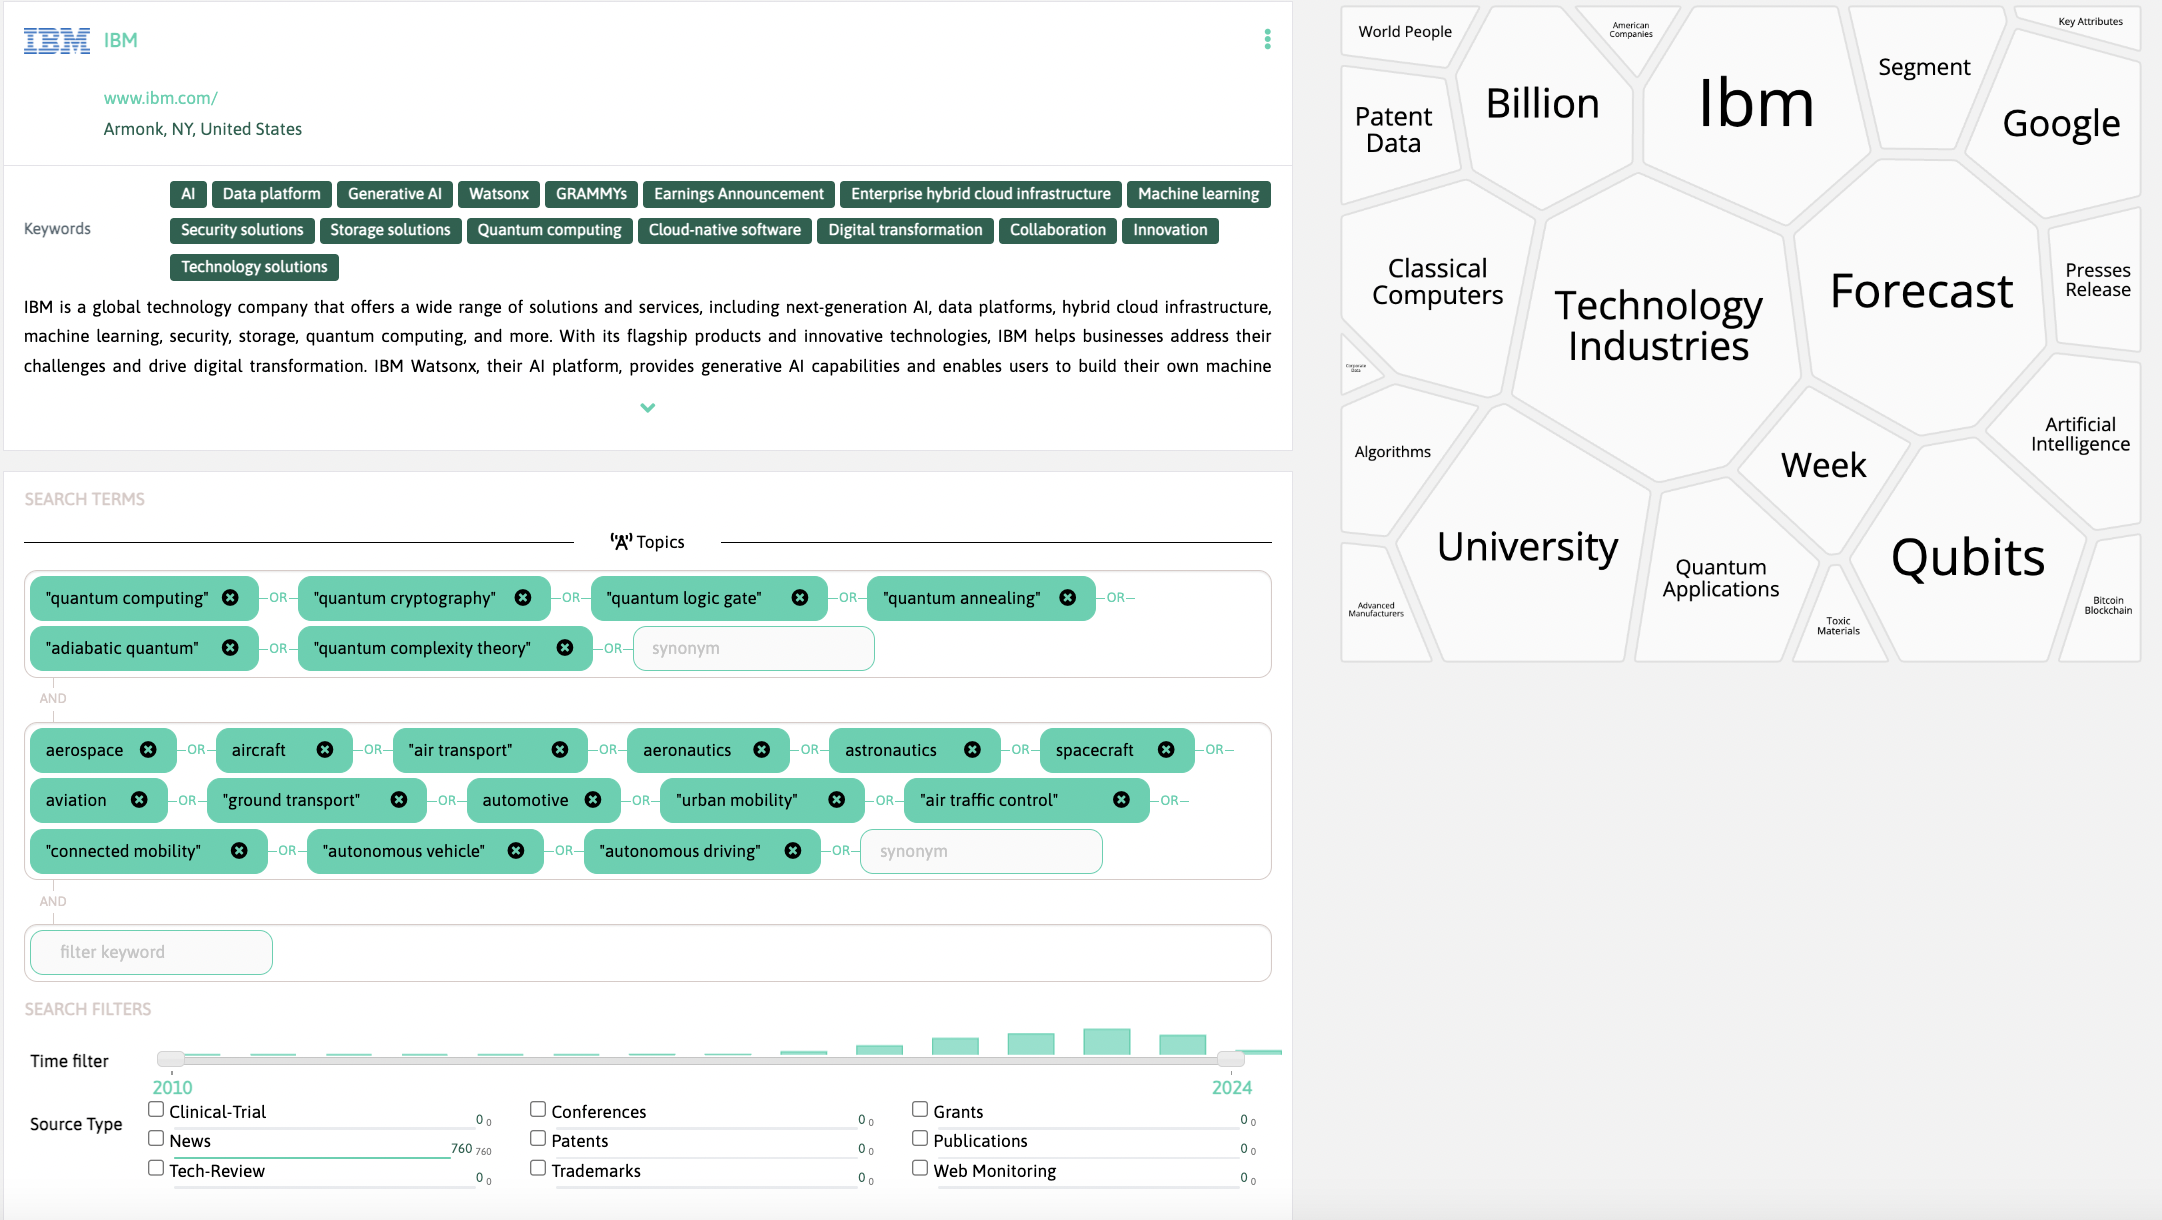
The Foam Tree is right below the search boxes and is generated on-the-fly as you add new keywords and filters. It shows the most common keywords within the topic you are researching.
The bigger the size of the cluster, the higher the number of references that contain the keyword.
When clicking in any of the clusters, the keyword is added into a new search box (as an AND operator). And the discovery engine will update the results that meet all the criteria you have specified.
We aggregate hundreds of data sources, and millions of references are indexed and weekly updated. When searching, it is likely that, even for niche topics, you will get hundreds to thousands of results, hence the need for advanced filtering.
Find them fixed on the left of the page, throughout all pages (except for Company Profile pages). They are pretty straight-forward, and will help you cut down hours of search time.
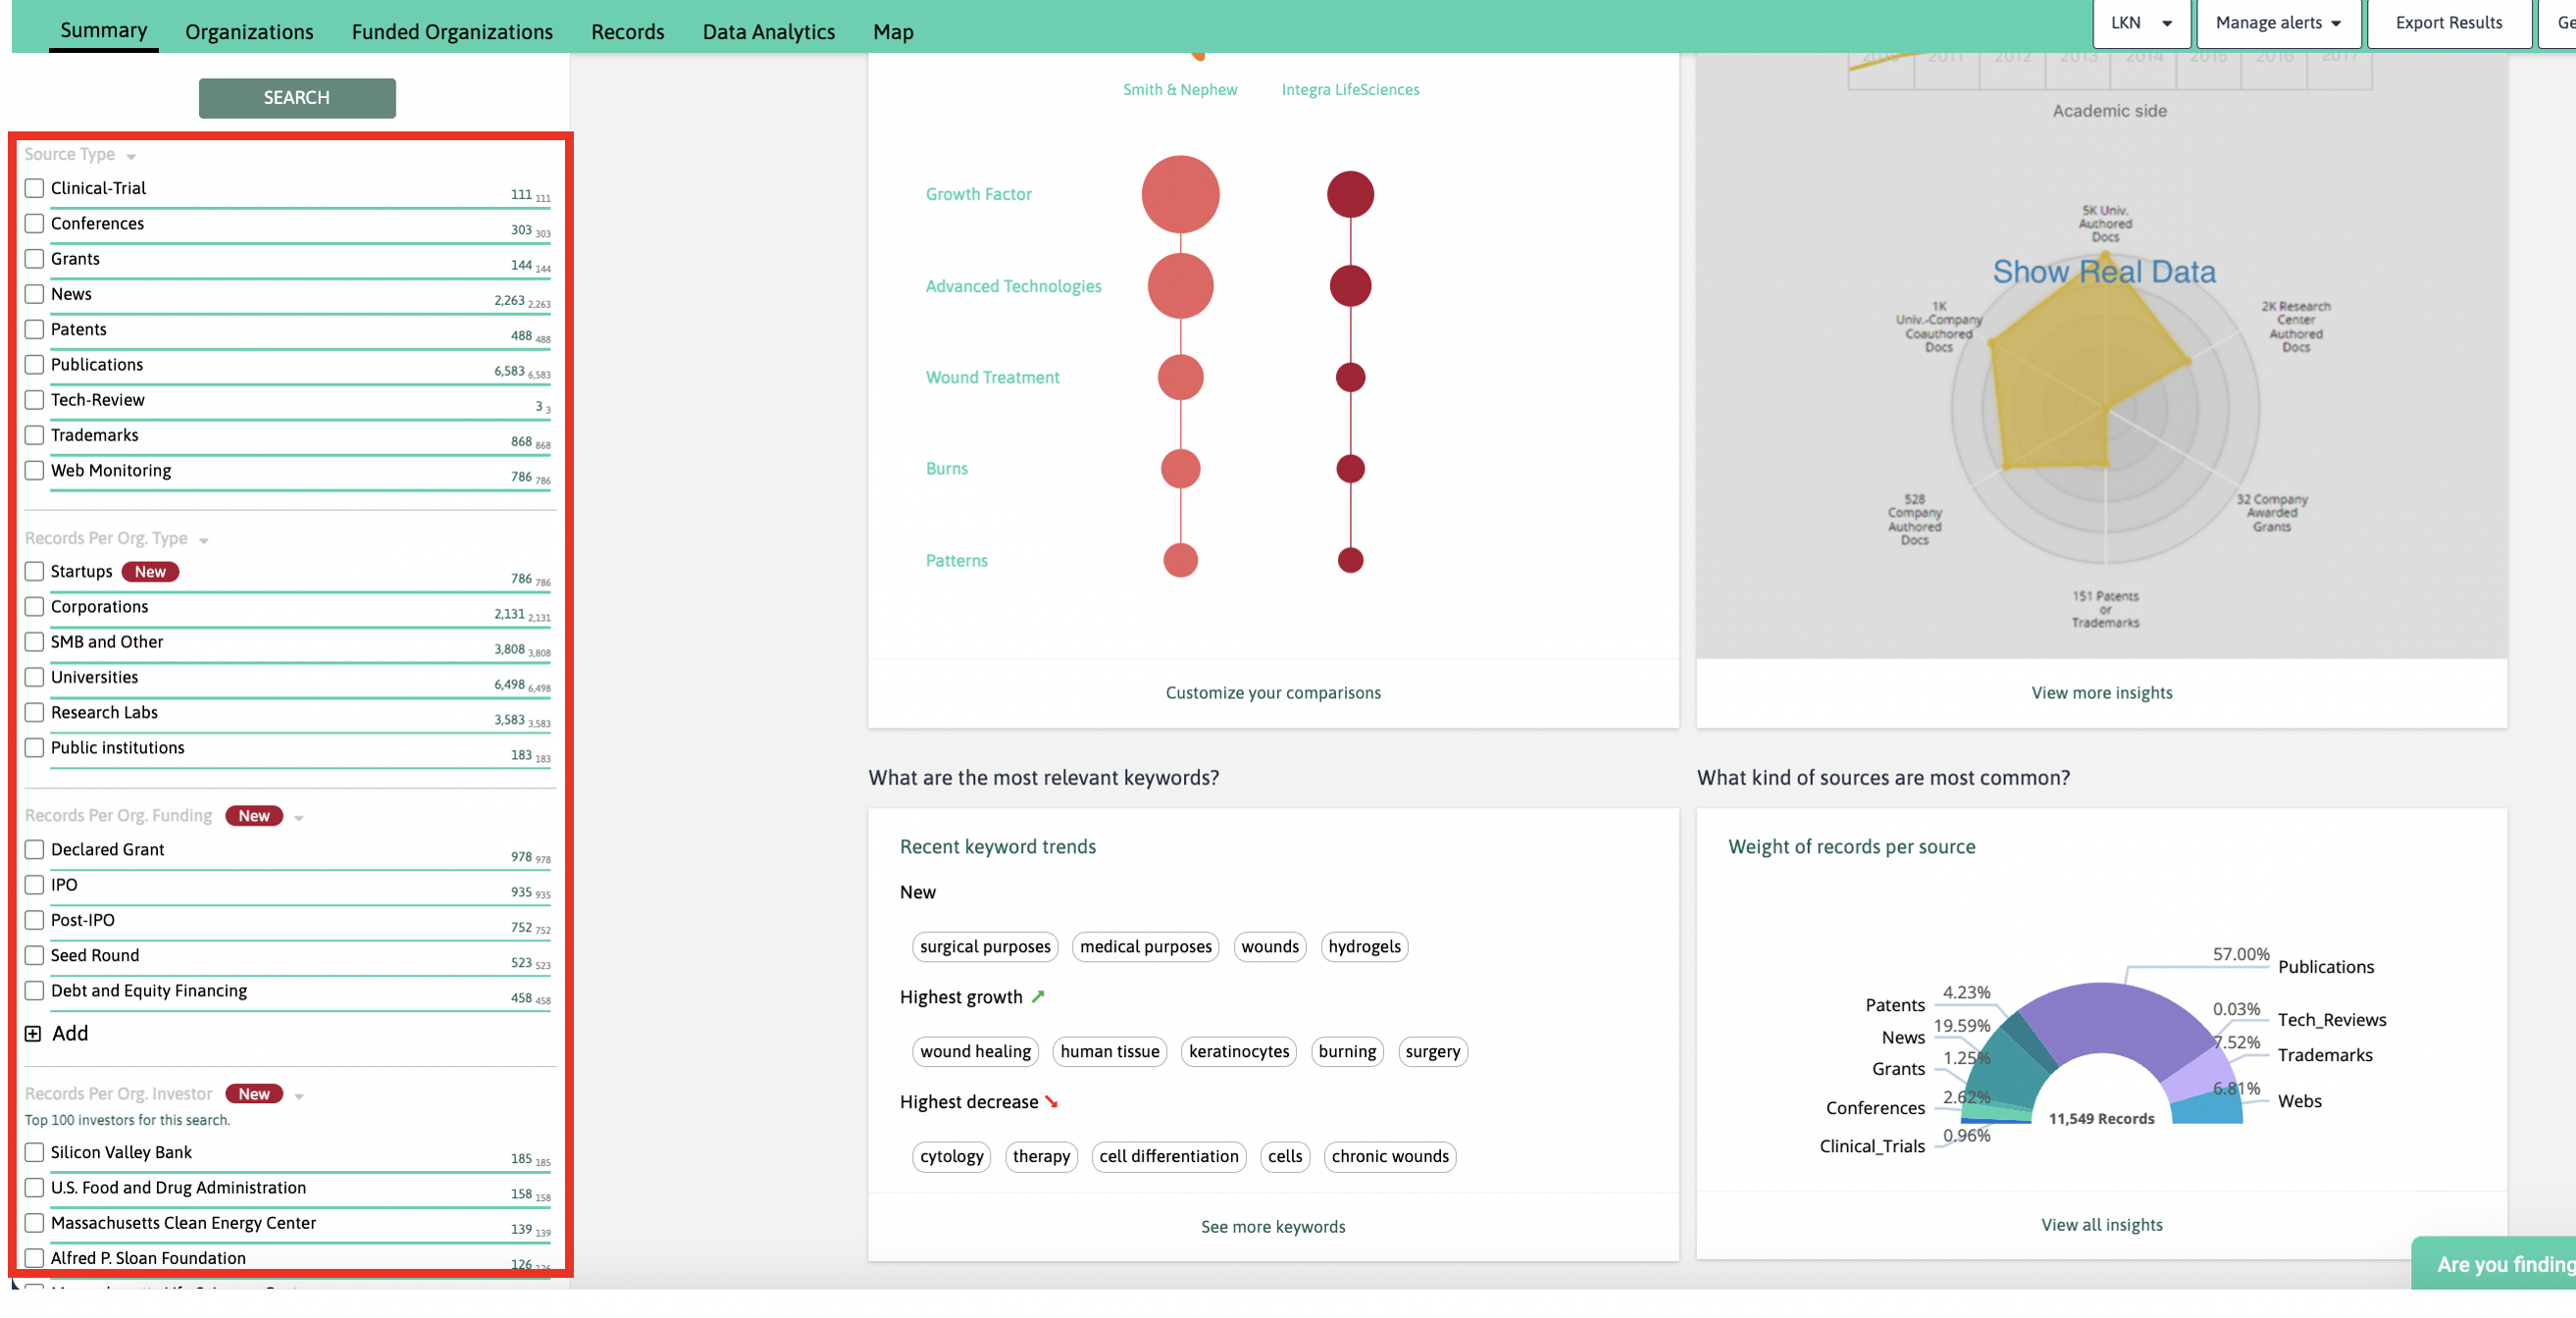
Source TypeFilter
Our data comes both from academia and industry.
Often, academic data sources (grants, scientific publications, conference proceedings) mean early stages of development. While industrial sources (patents, trademarks, news, corporate webs) tend to provide closer to market developments and products. At Linknovate you will find both data source types.
Data sources we aggregate:
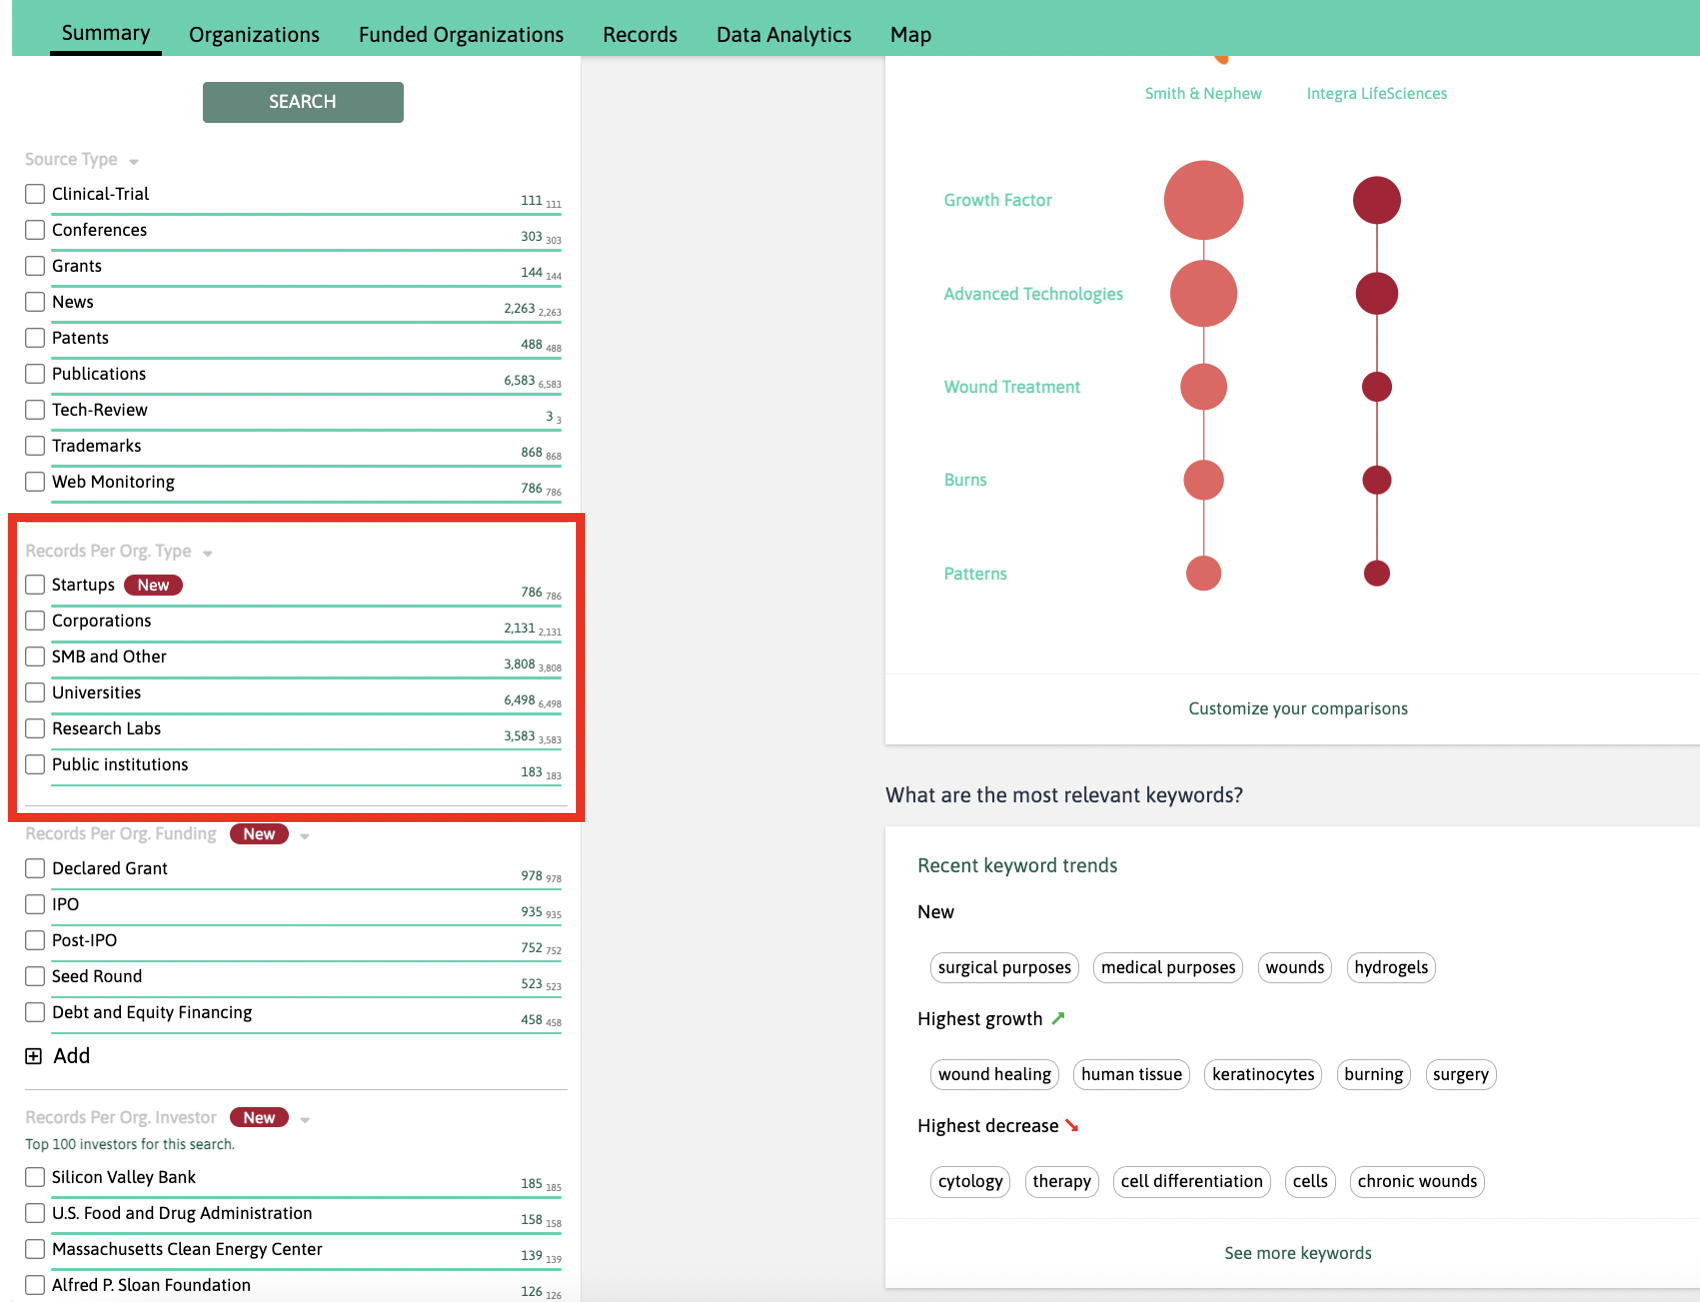
Organization TypeFilter
You can filter by type of organization:
TimeFilter
Timeline to allow for selection of periods of time, from 2010 to present.
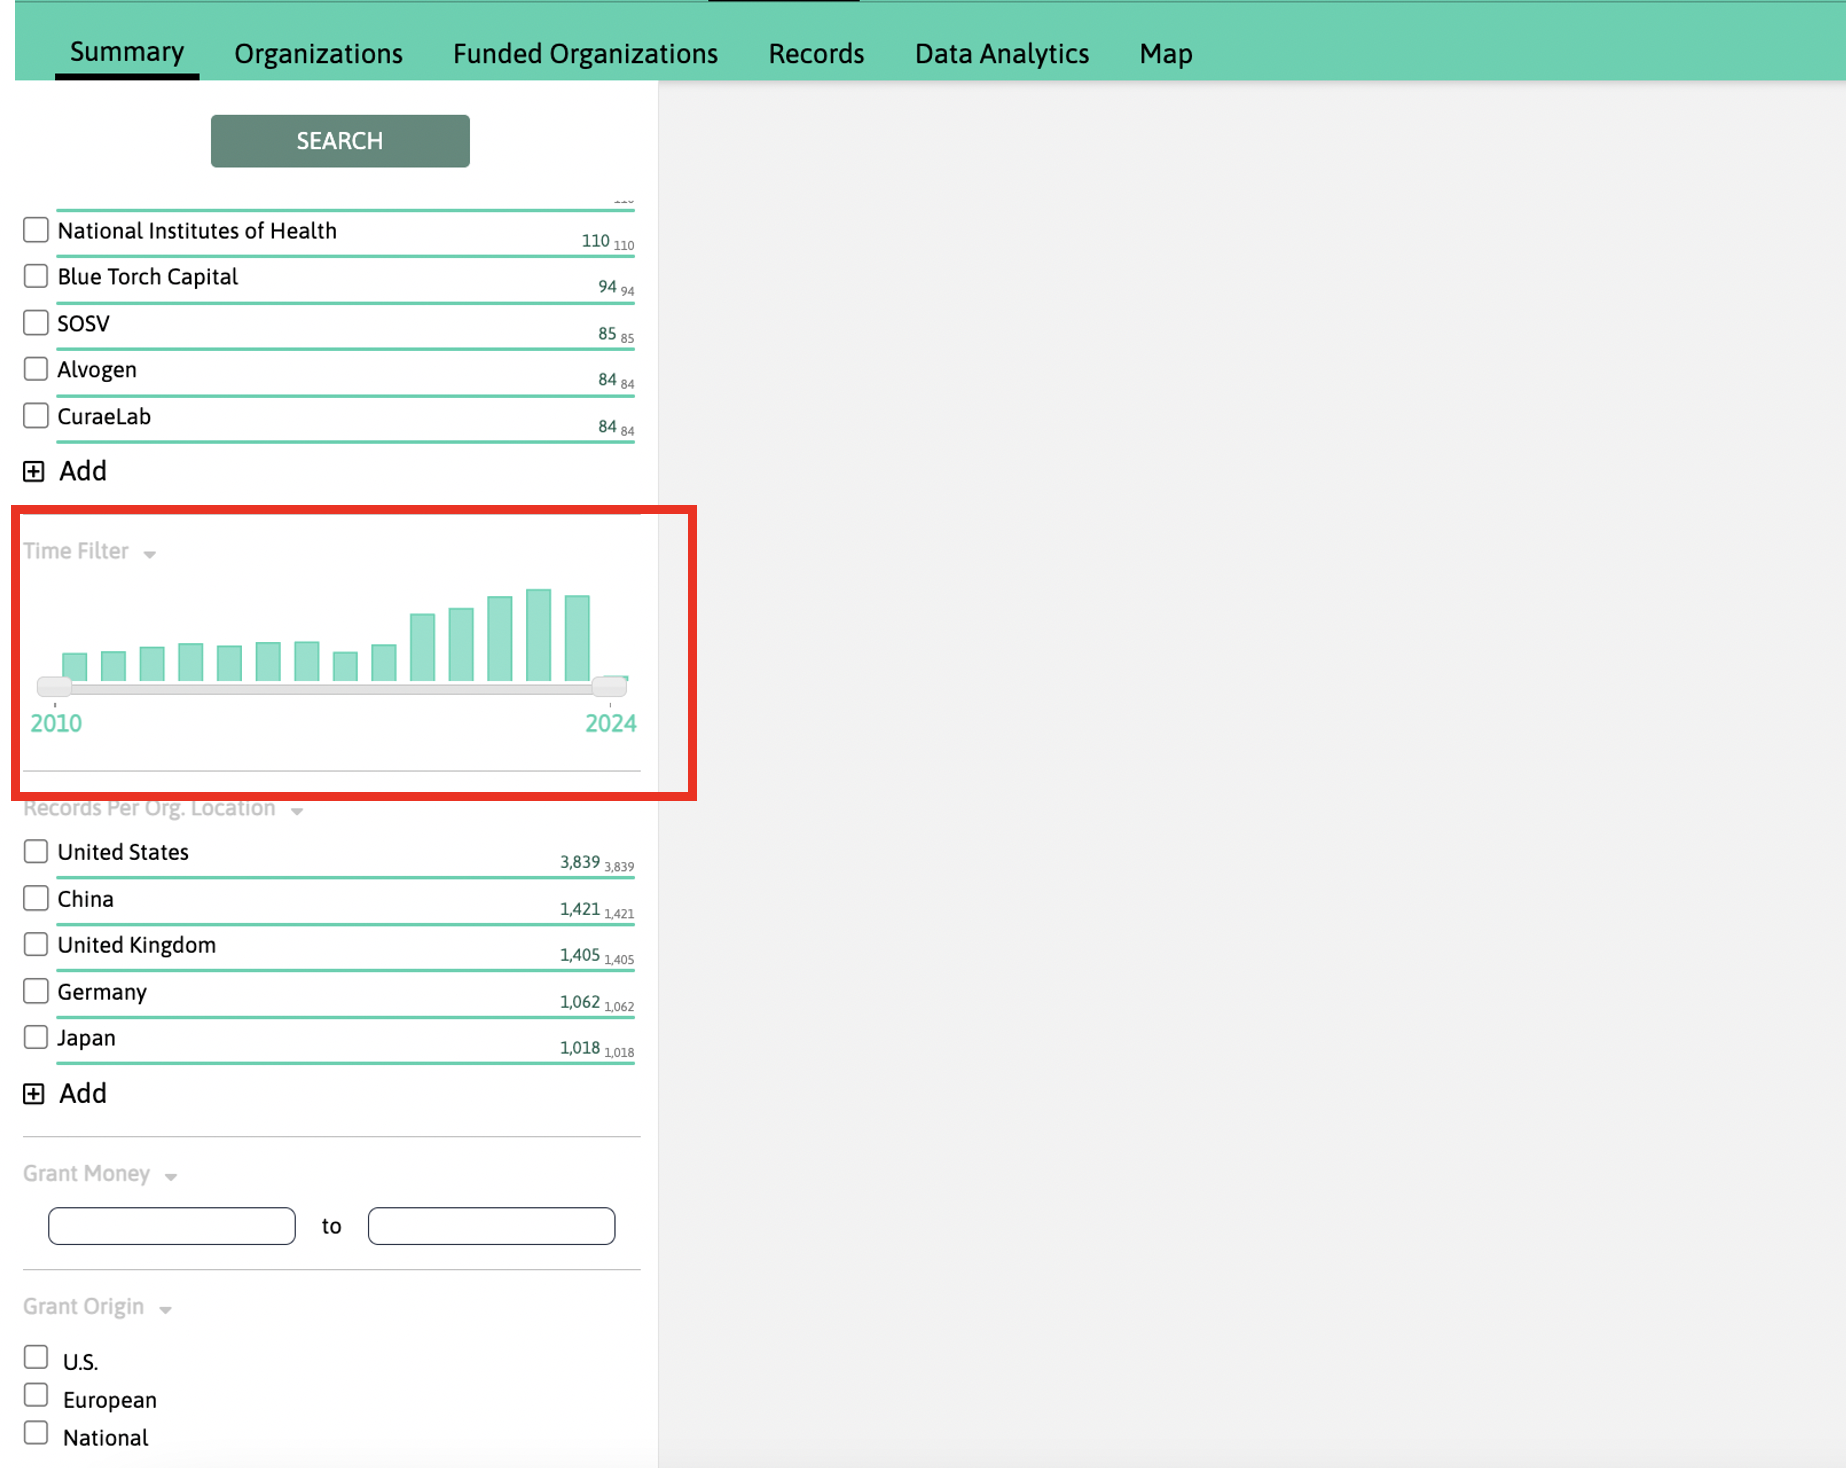
Organization LocationFilter
Are you looking for companies or universities at a specific location? Select or add (separated by commas) the country(s) you are interested in for viewing geolocation-data only.
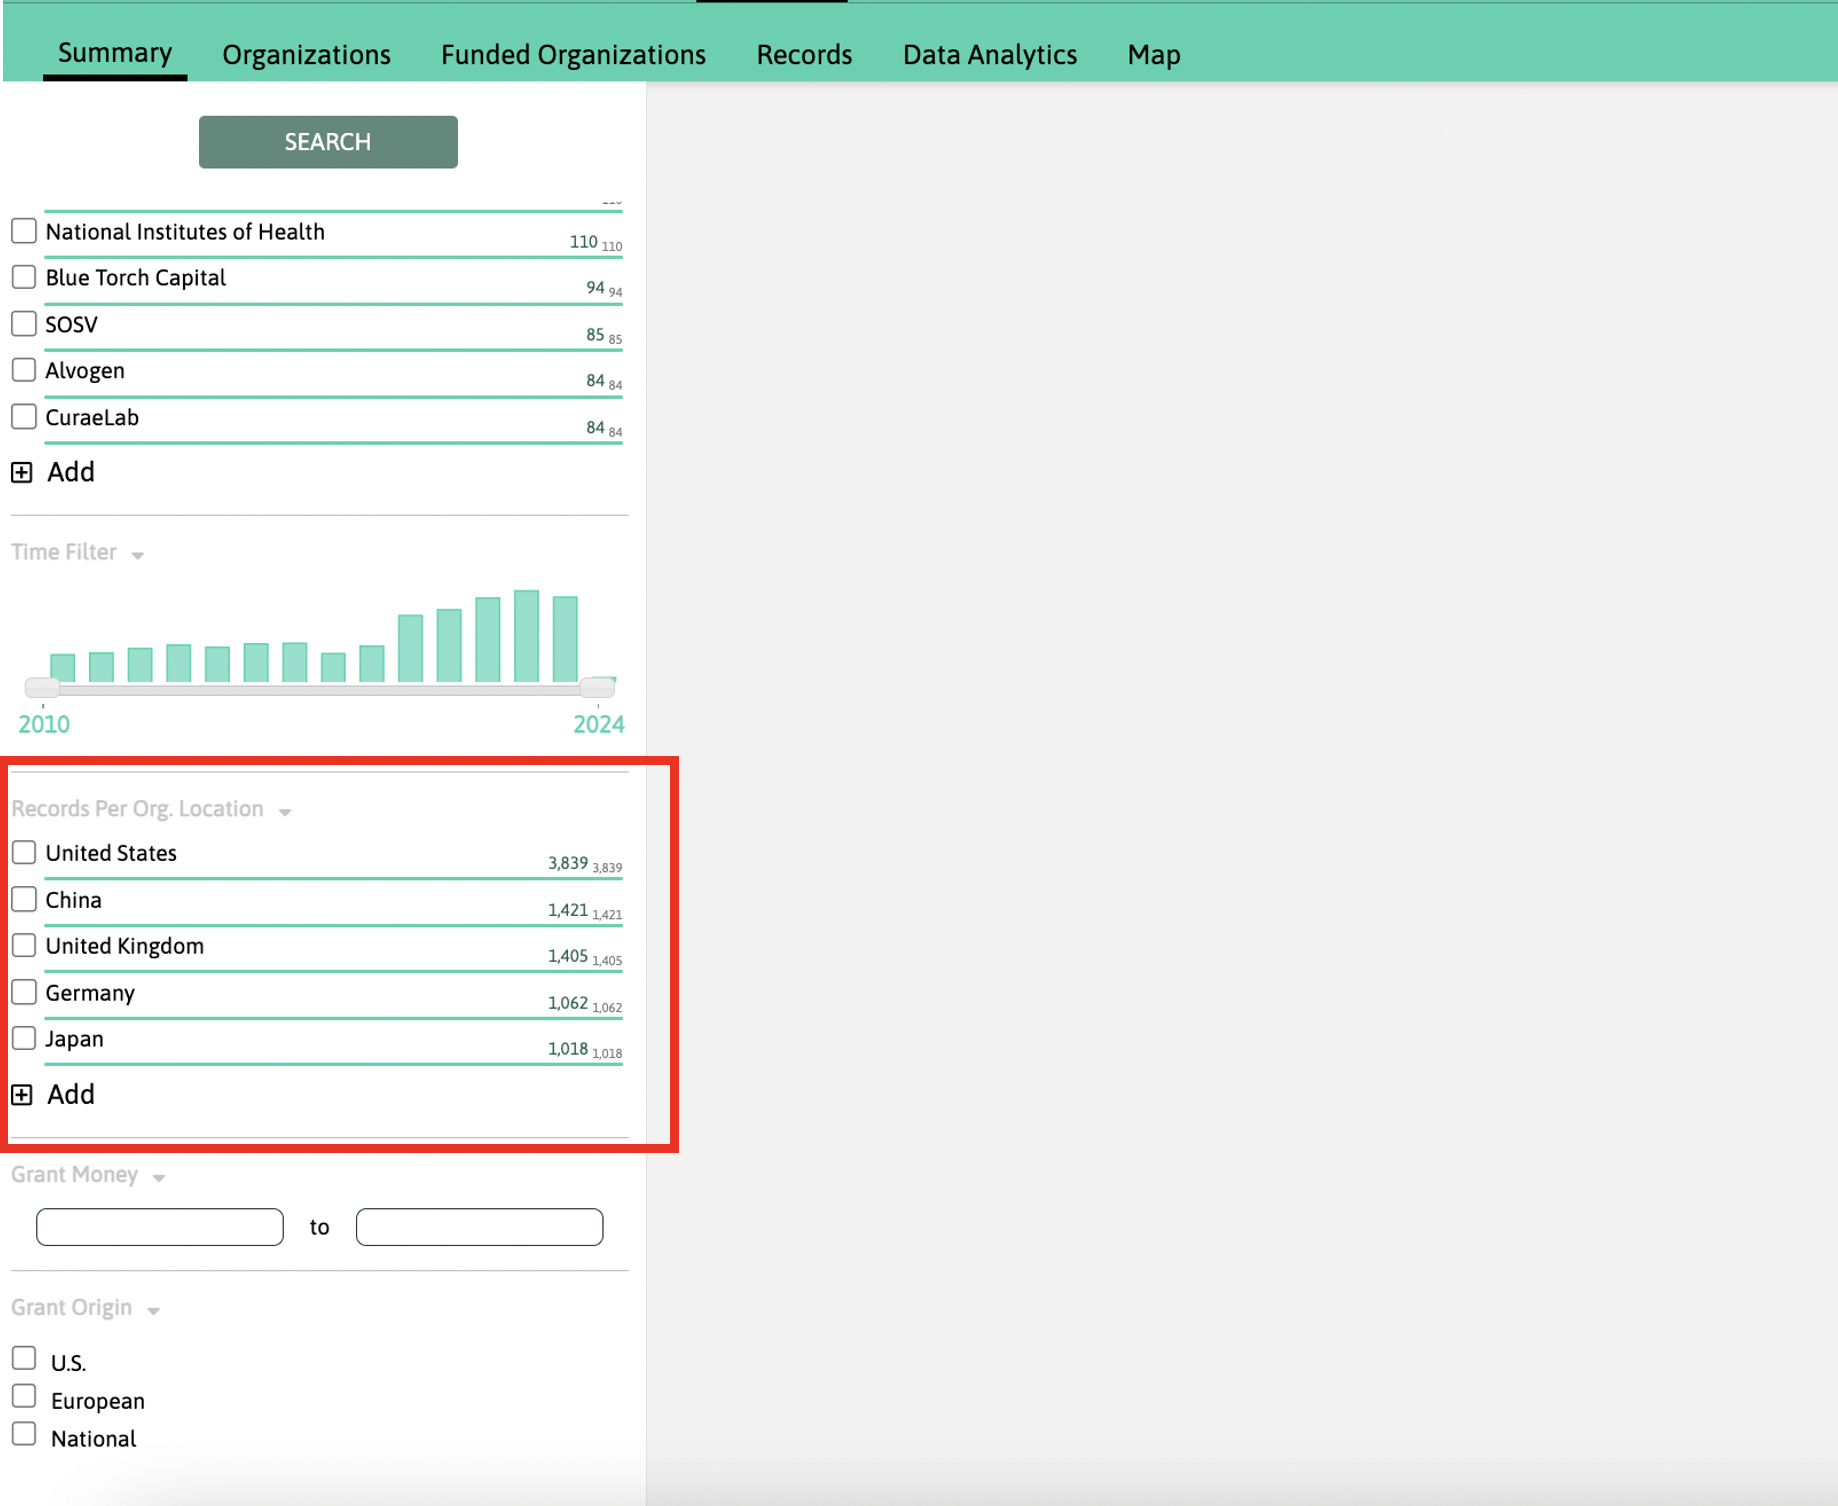
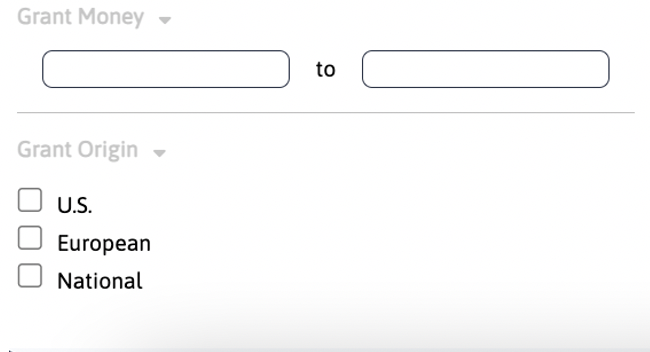
GrantsFilter
When looking for grant awardees, or grant records:
Once our search is set, we can start navigating through the platform and its features. Don’t forget that you can change your query on-the-go any time: results will automatically change according to your new search.
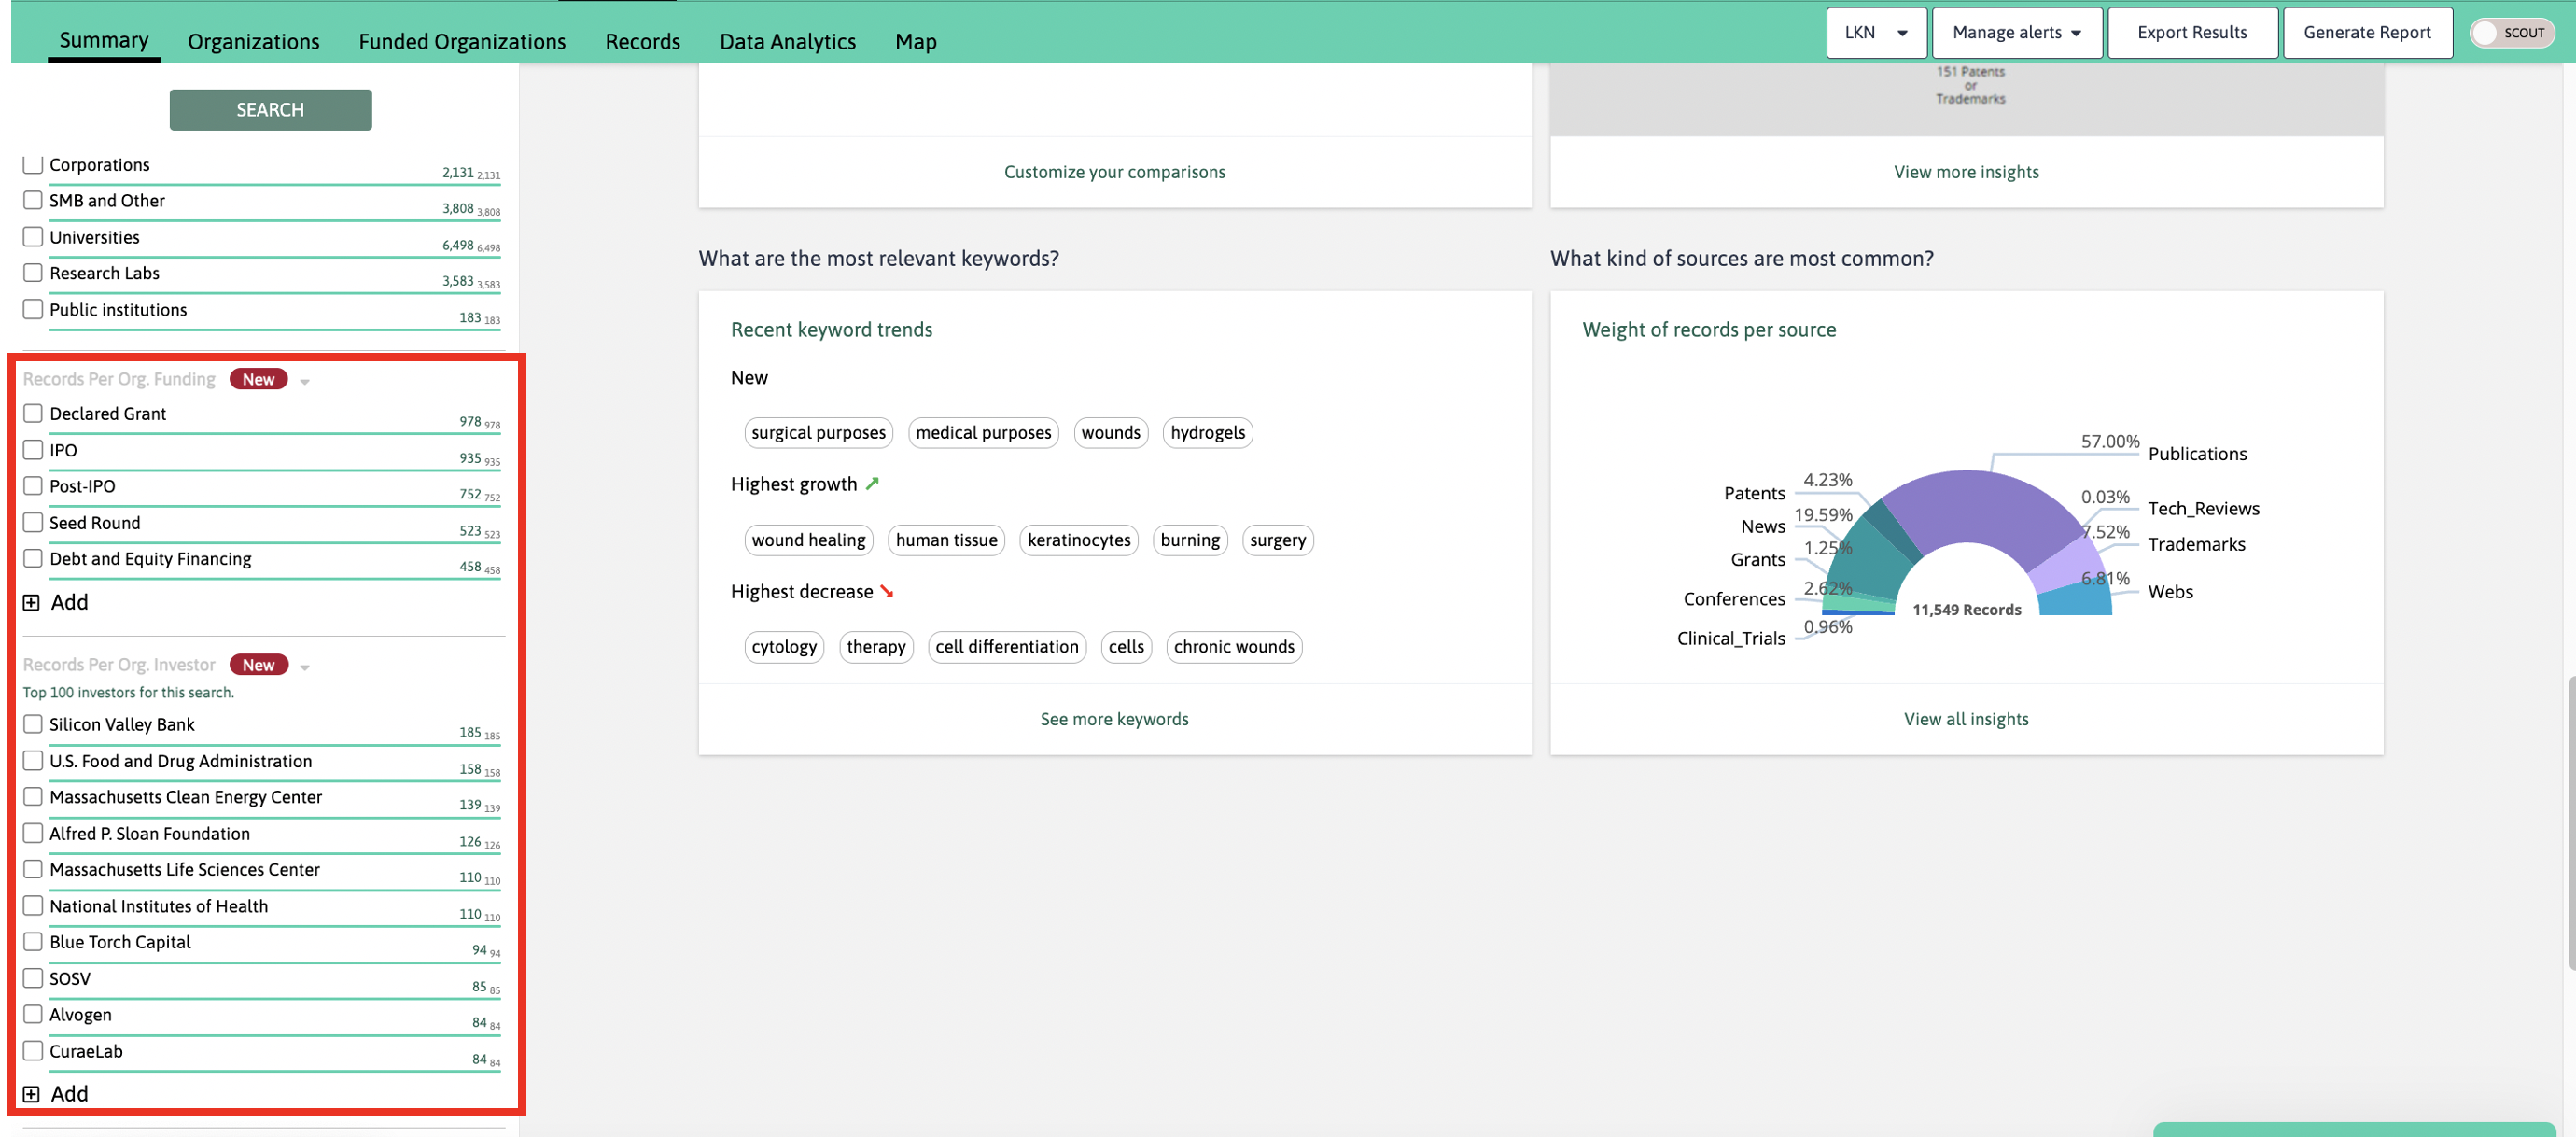
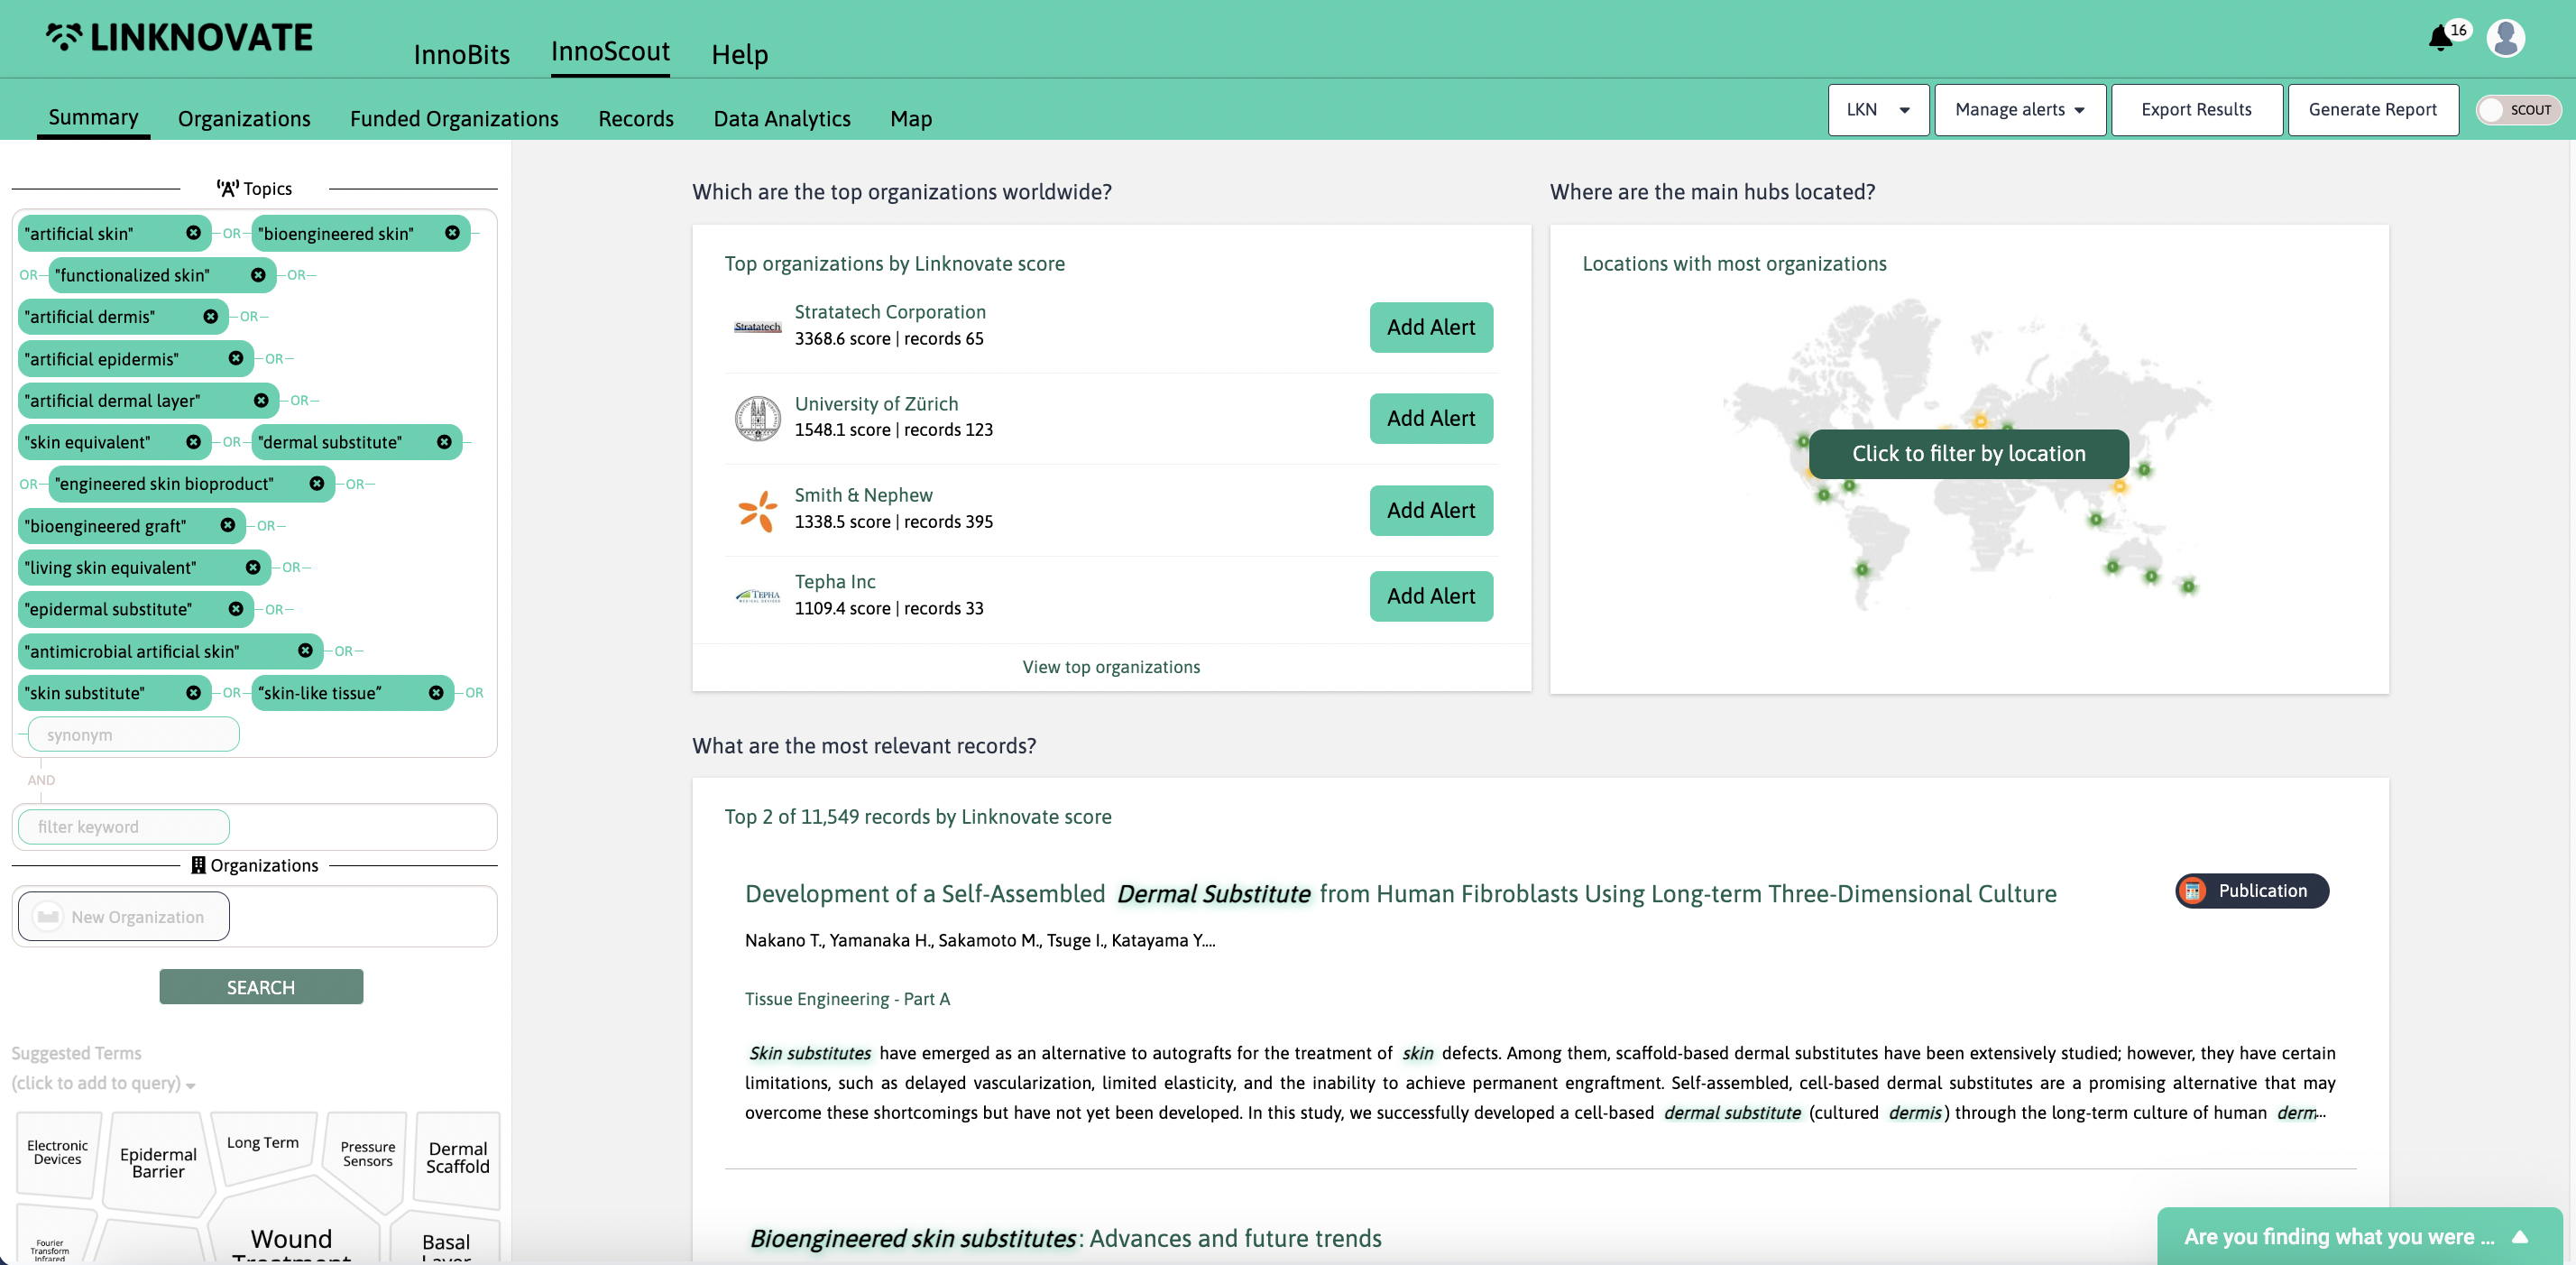
The summary page will help you get an outlook on the query you’re working on, showing general information such as the top organizations, the top records, and the numbers of records linked to the search.
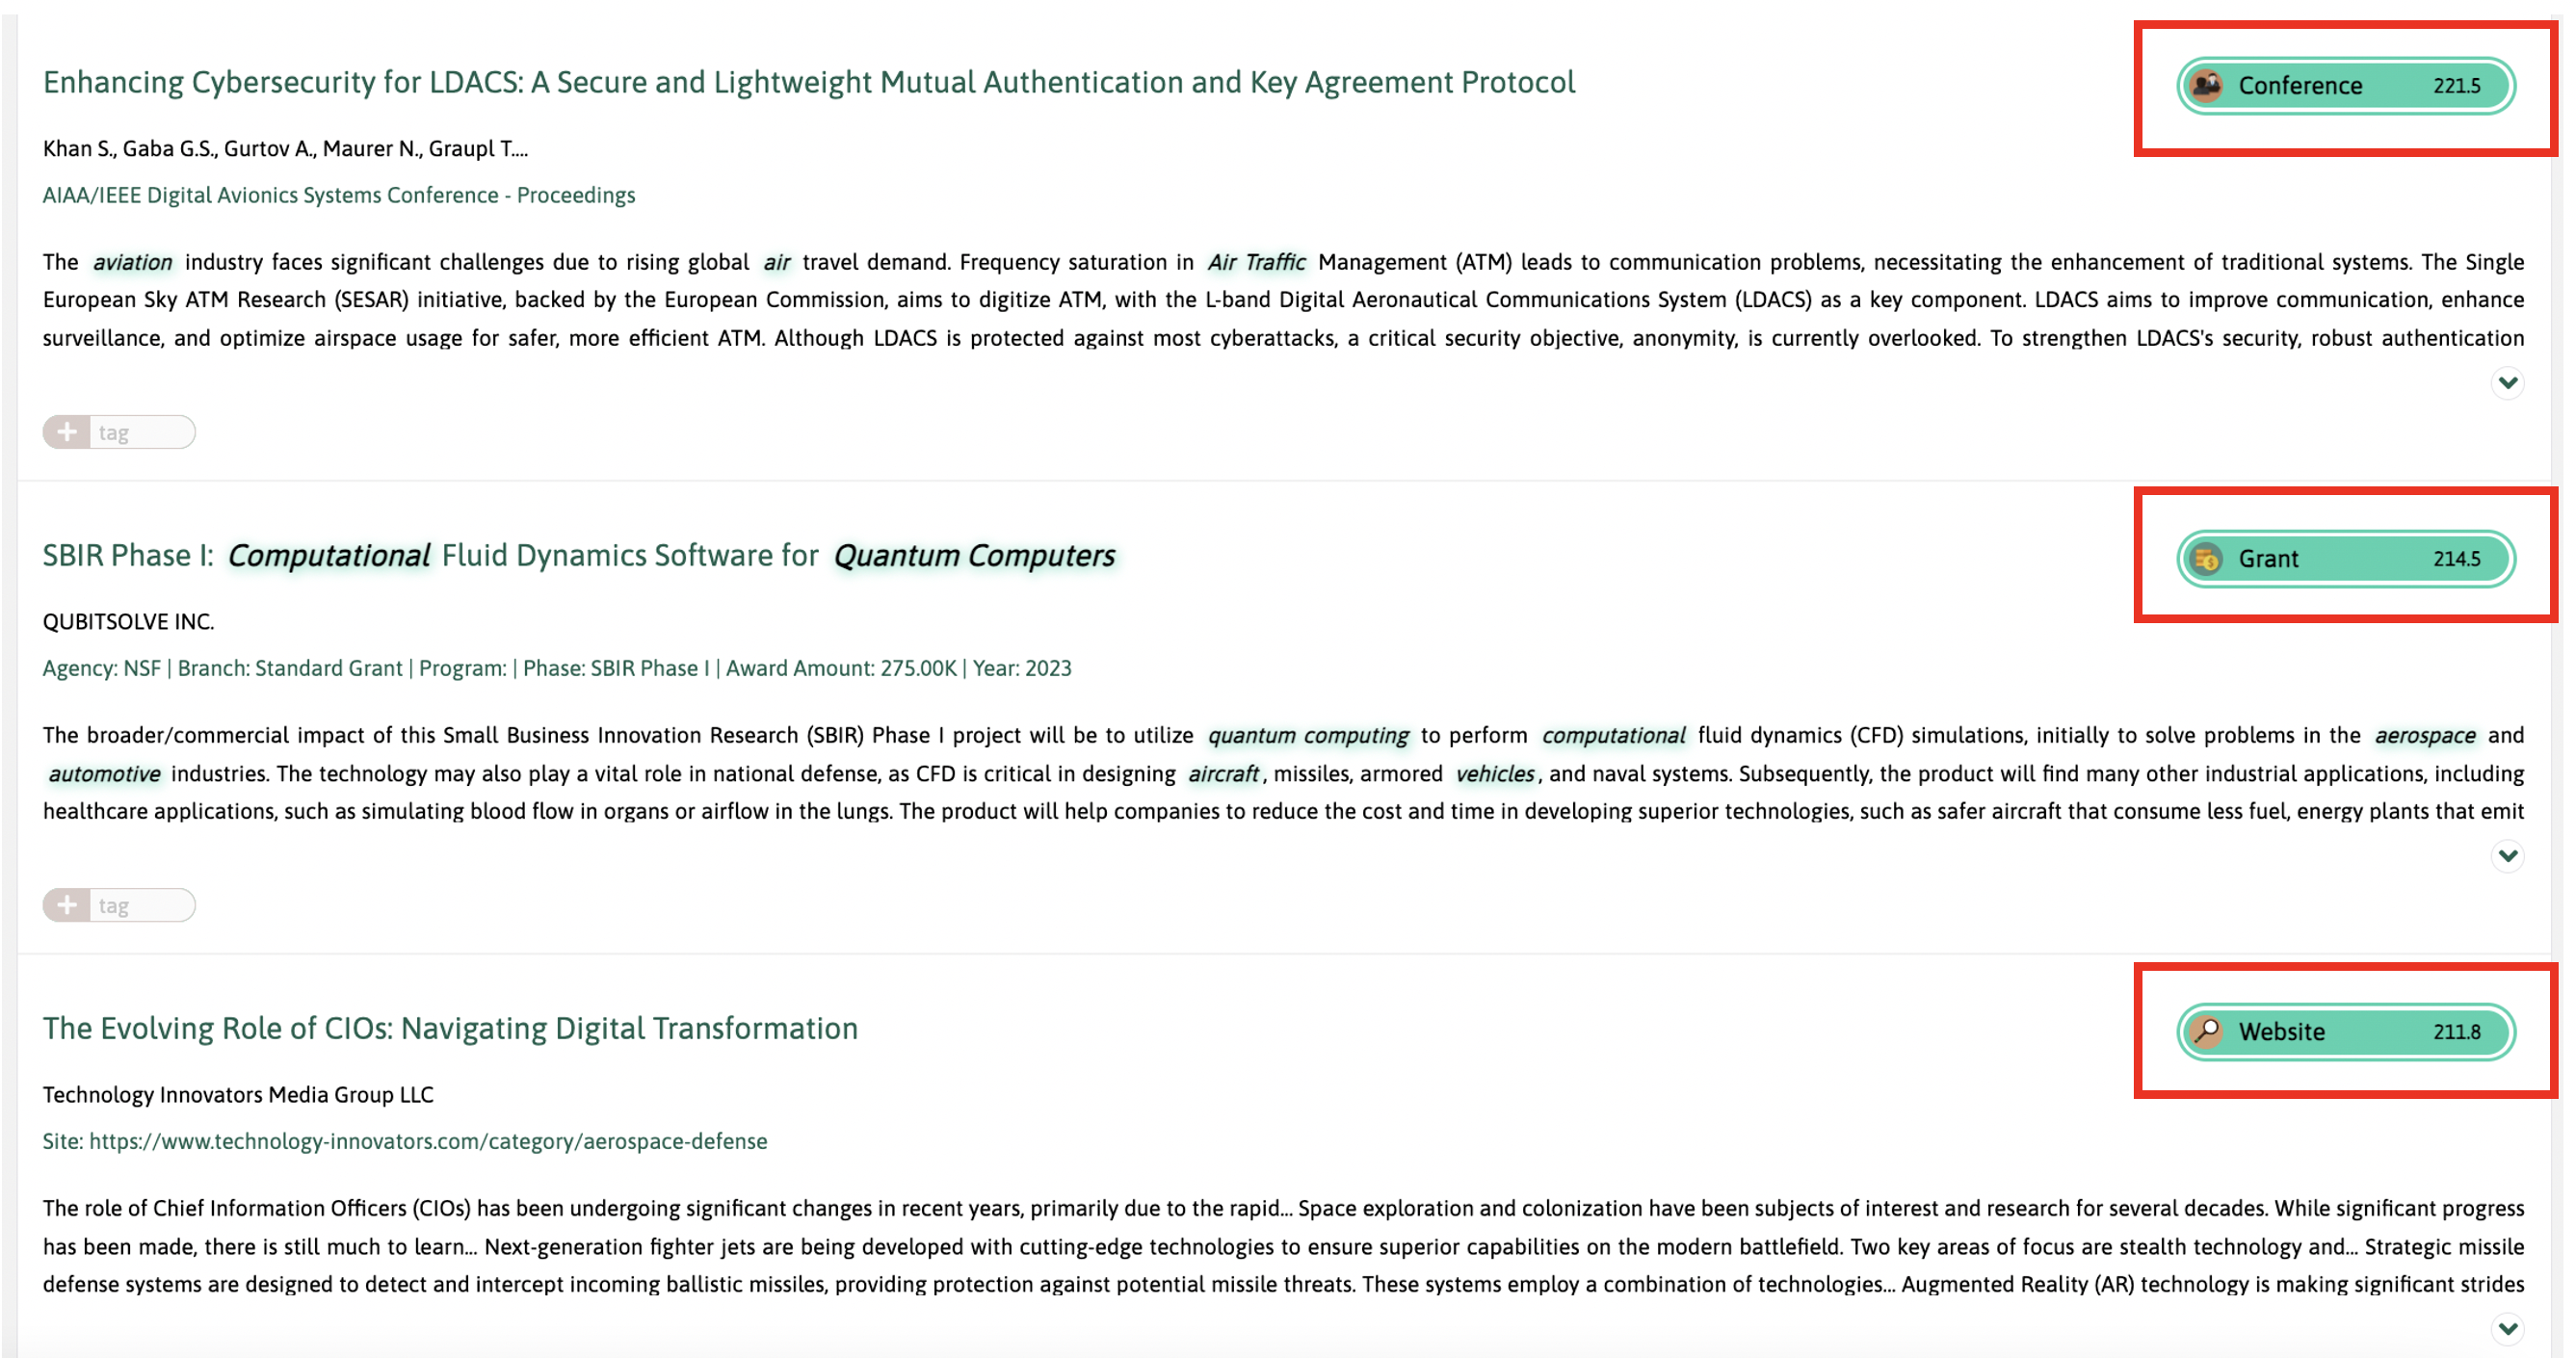
In the “Records” section you can go through all the publications, news, conferences, grants, trademarks and patents related to your query. The results are presented in order of relevance, which is calculated on a text-based algorithm that takes into account how many times the key words appear and which position they occupy on the text.
Each record is presented in a preview that includes the title, the organizations linked to the record, the source, and the first lines of the text. On the right, you can quickly check the type of record and the relevance score. Below, you can add tags to keep the records you are interested in organized.
Clicking on each record, you will get to the record profile, through which it is possible to check the abstract - or first lines - of the record, click through the organizations linked to the record, see the date of publication and the keywords, and share it with your team.
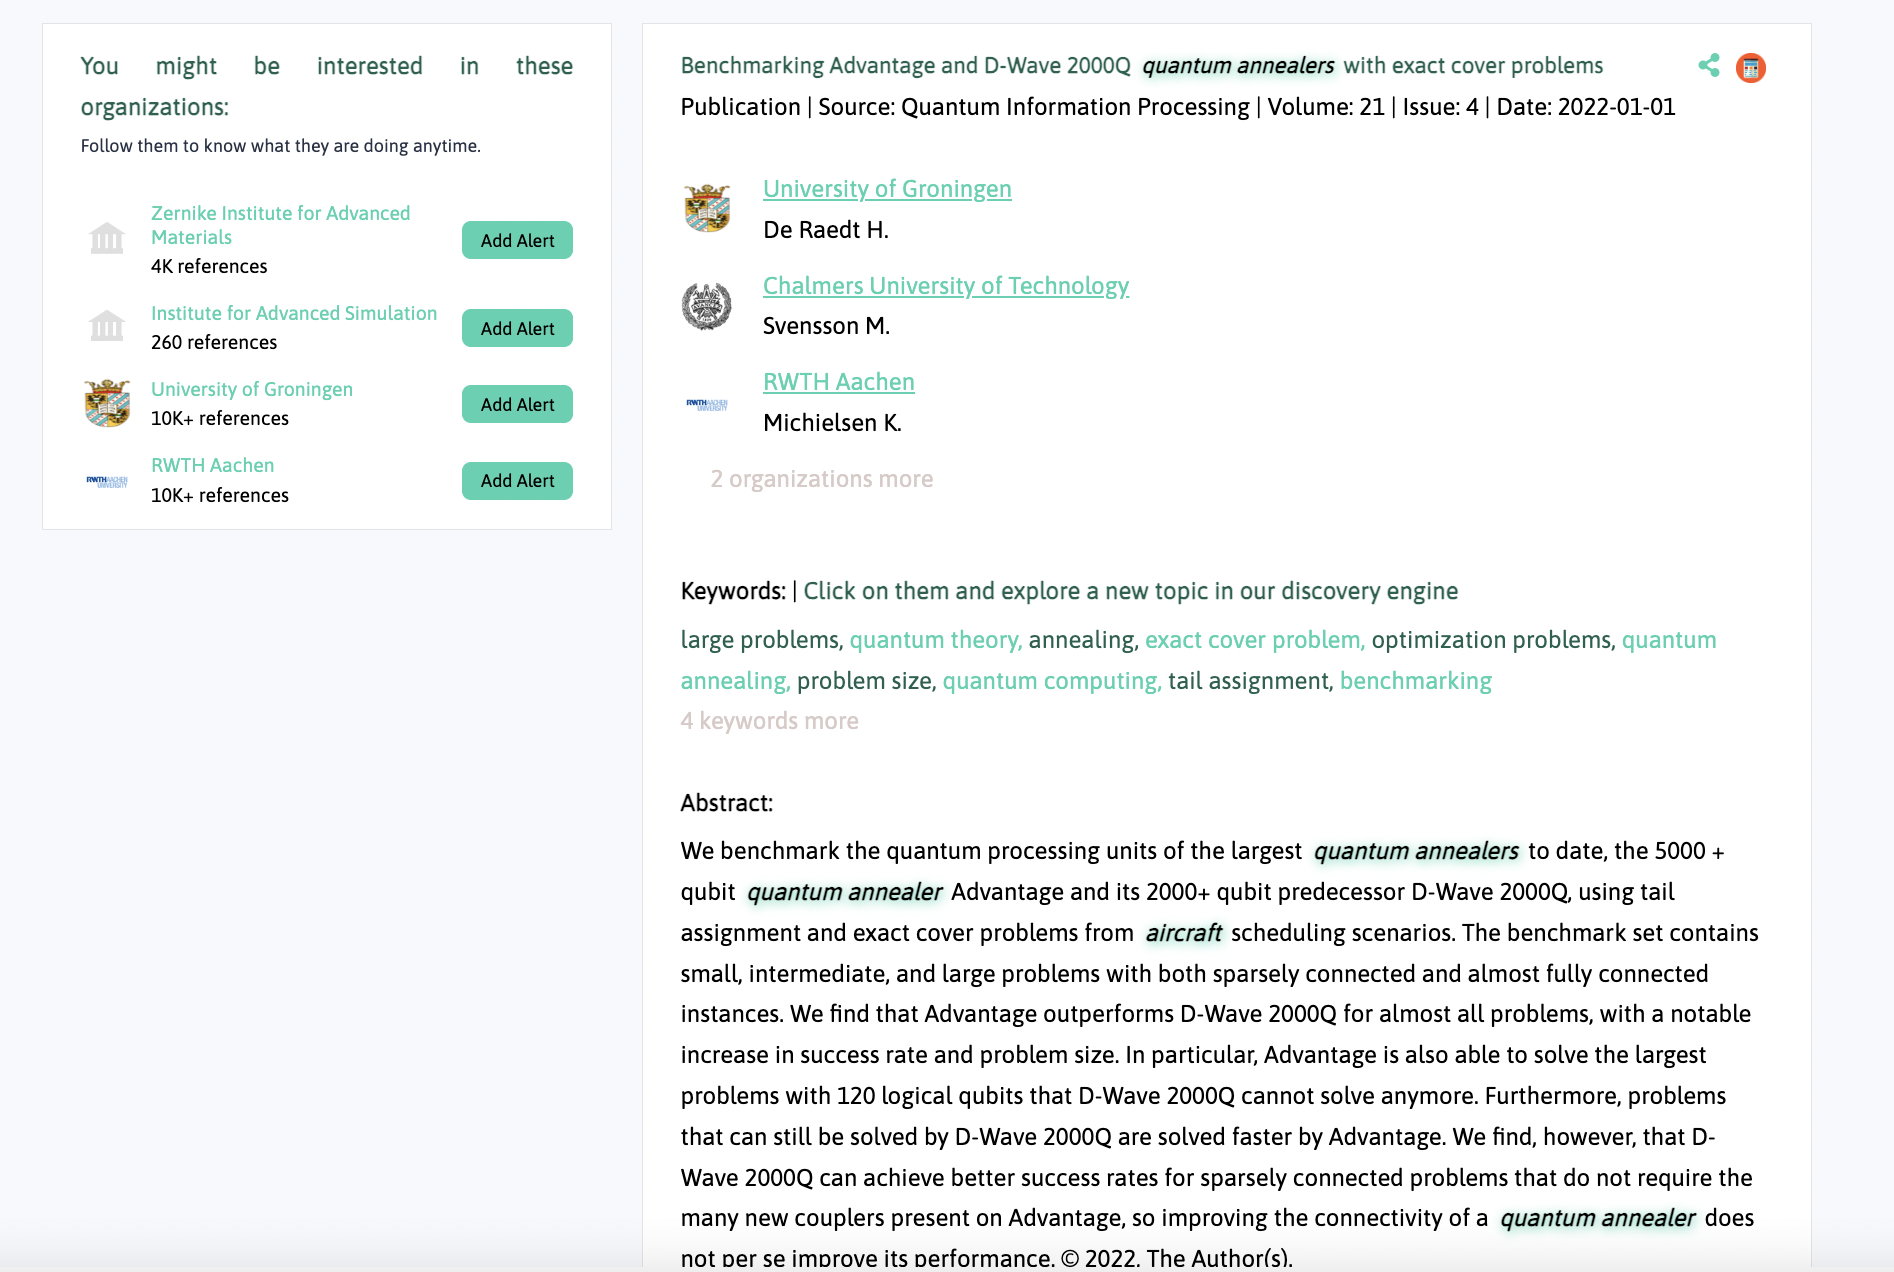
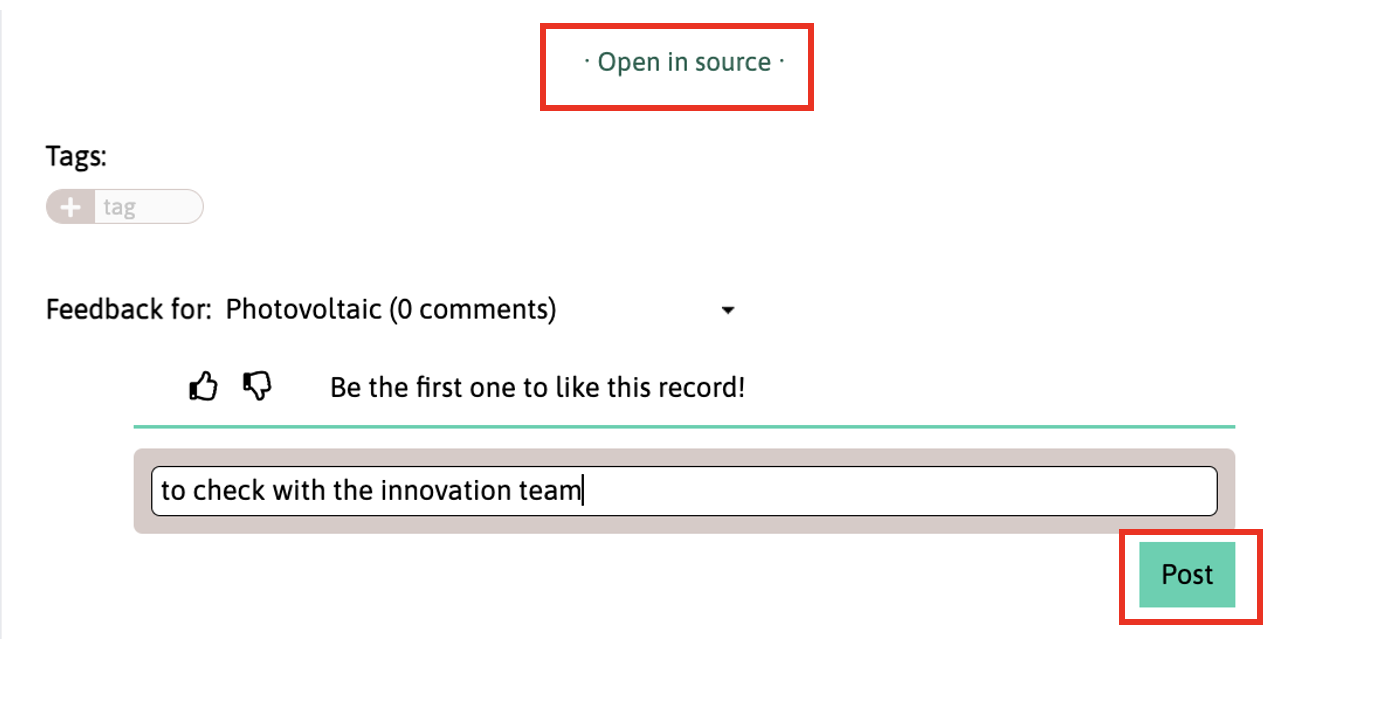
Clicking on the title or on the button “Open in source” above the abstract, it is possible to get to the original source of the record: in this way we keep transparency allowing users to check the origin of every record.
Finally, every user can tag and make comments on every record so that they can lead a collaborative discussion with their team.
Data Analytics
is the name we give to the cool graphs and charts you can check in the tab with the same name in the results page.
Data Analyticstab > Click on the graphs > Download.
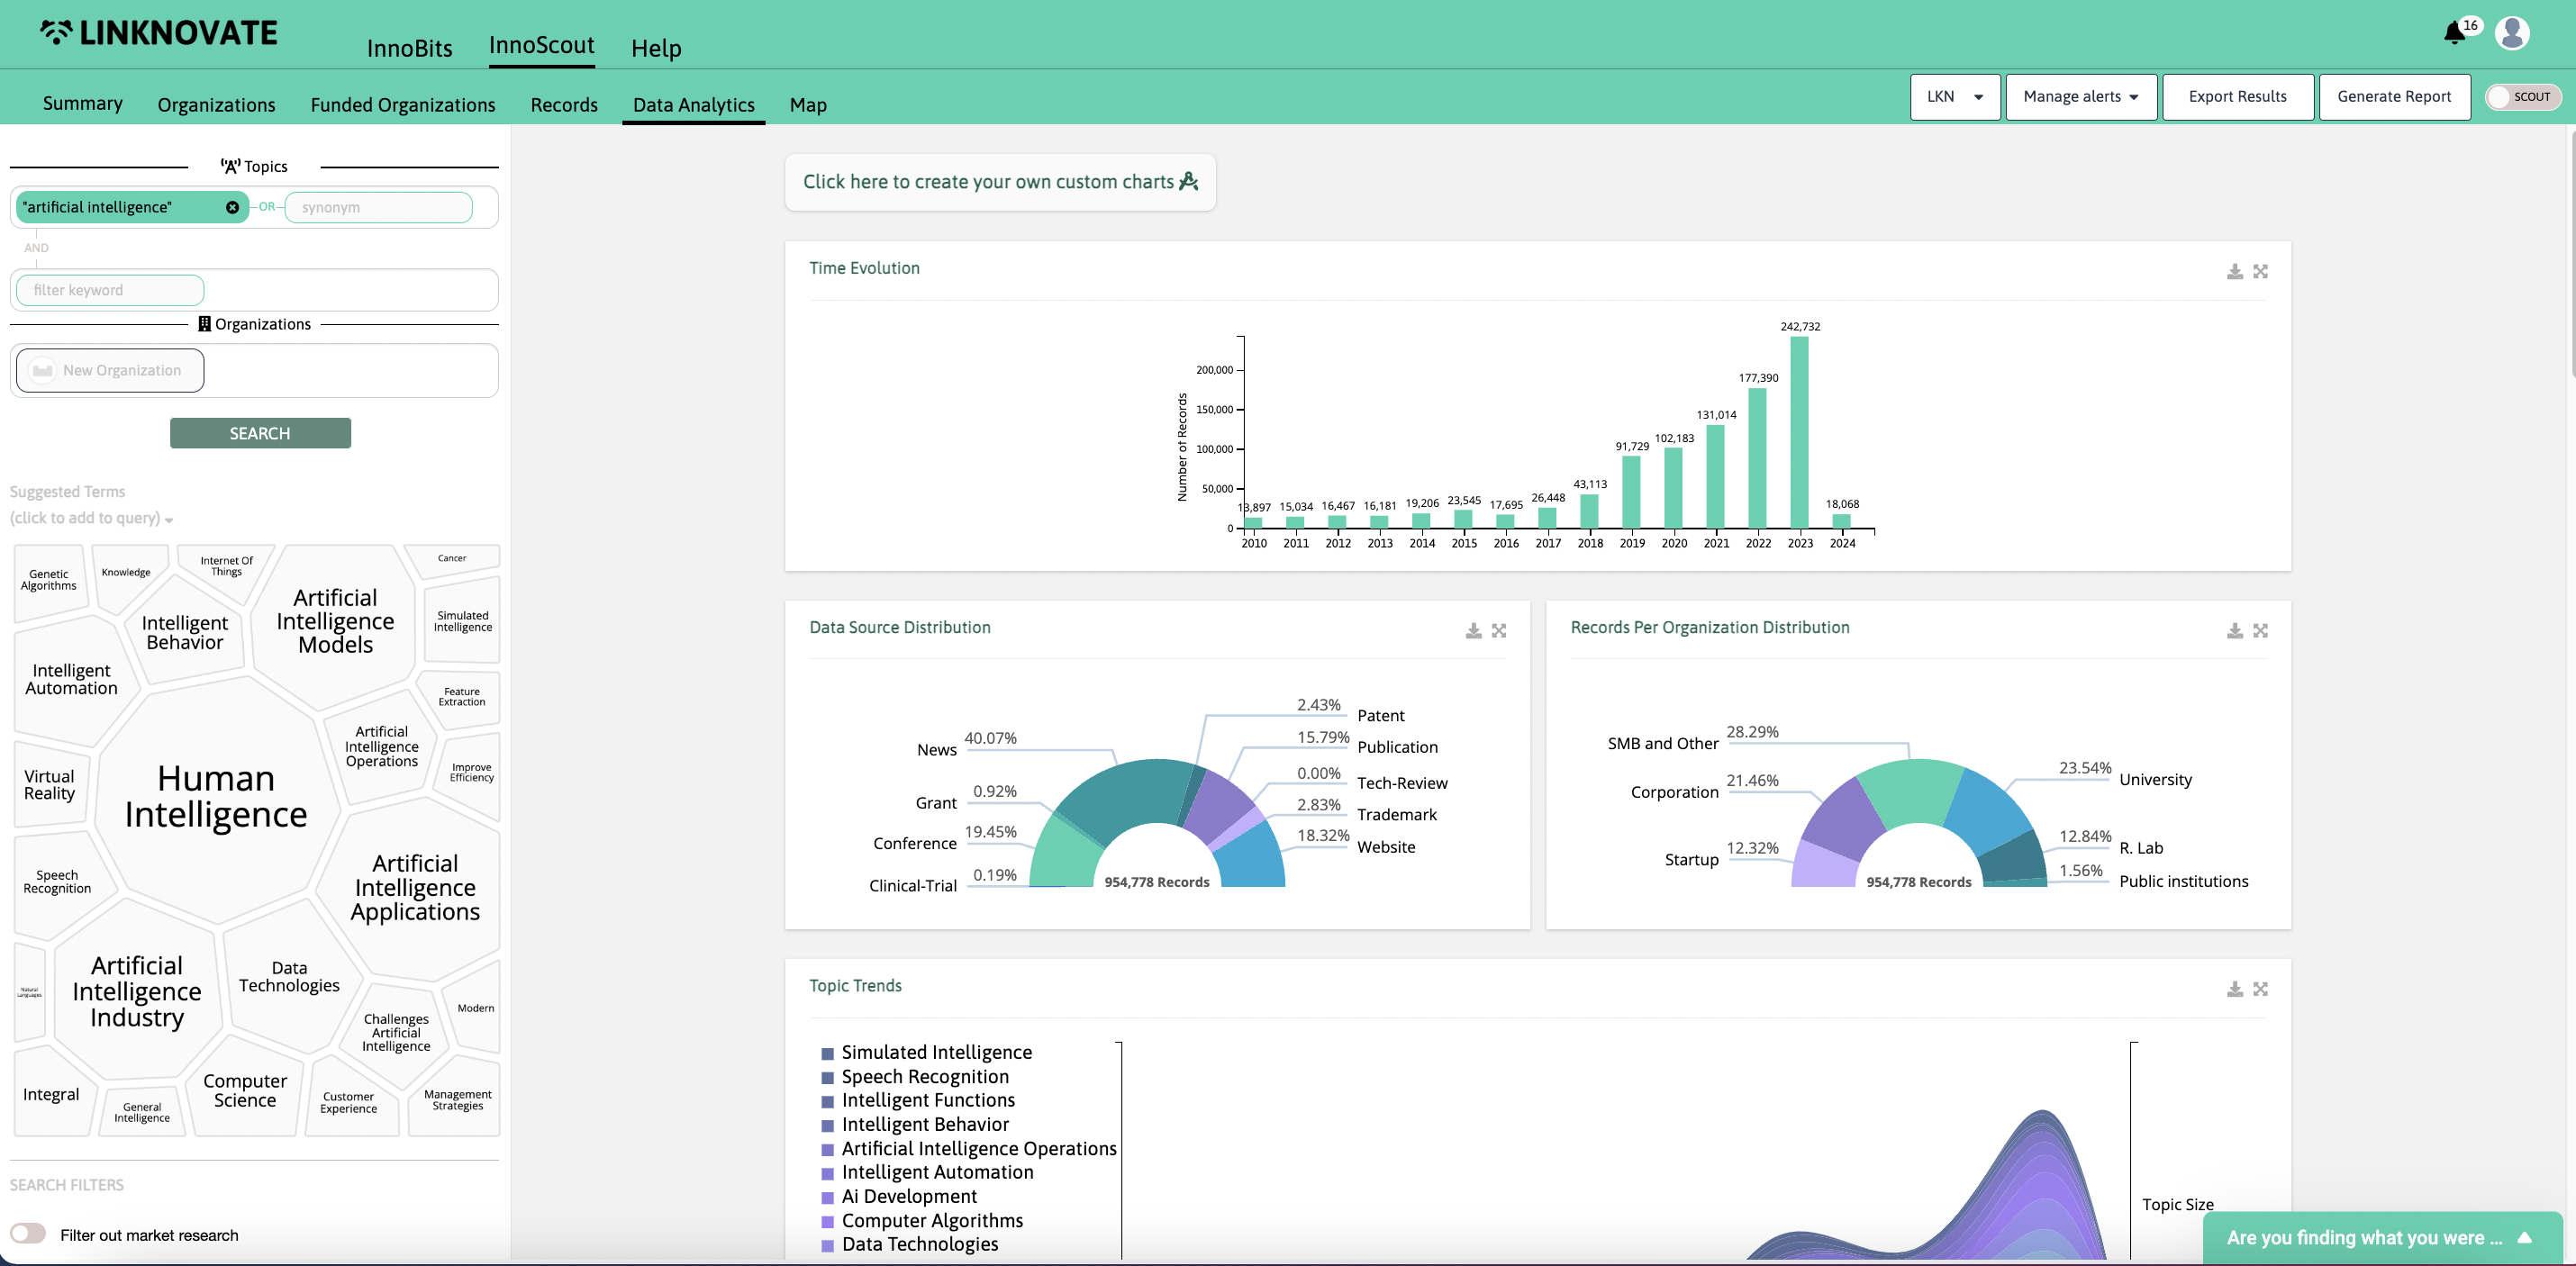
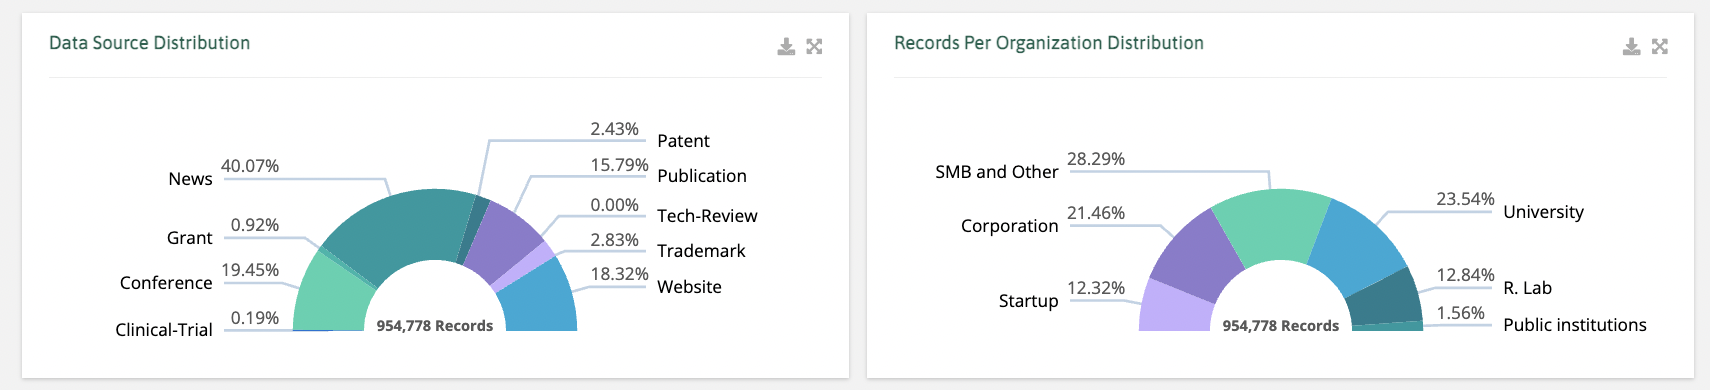
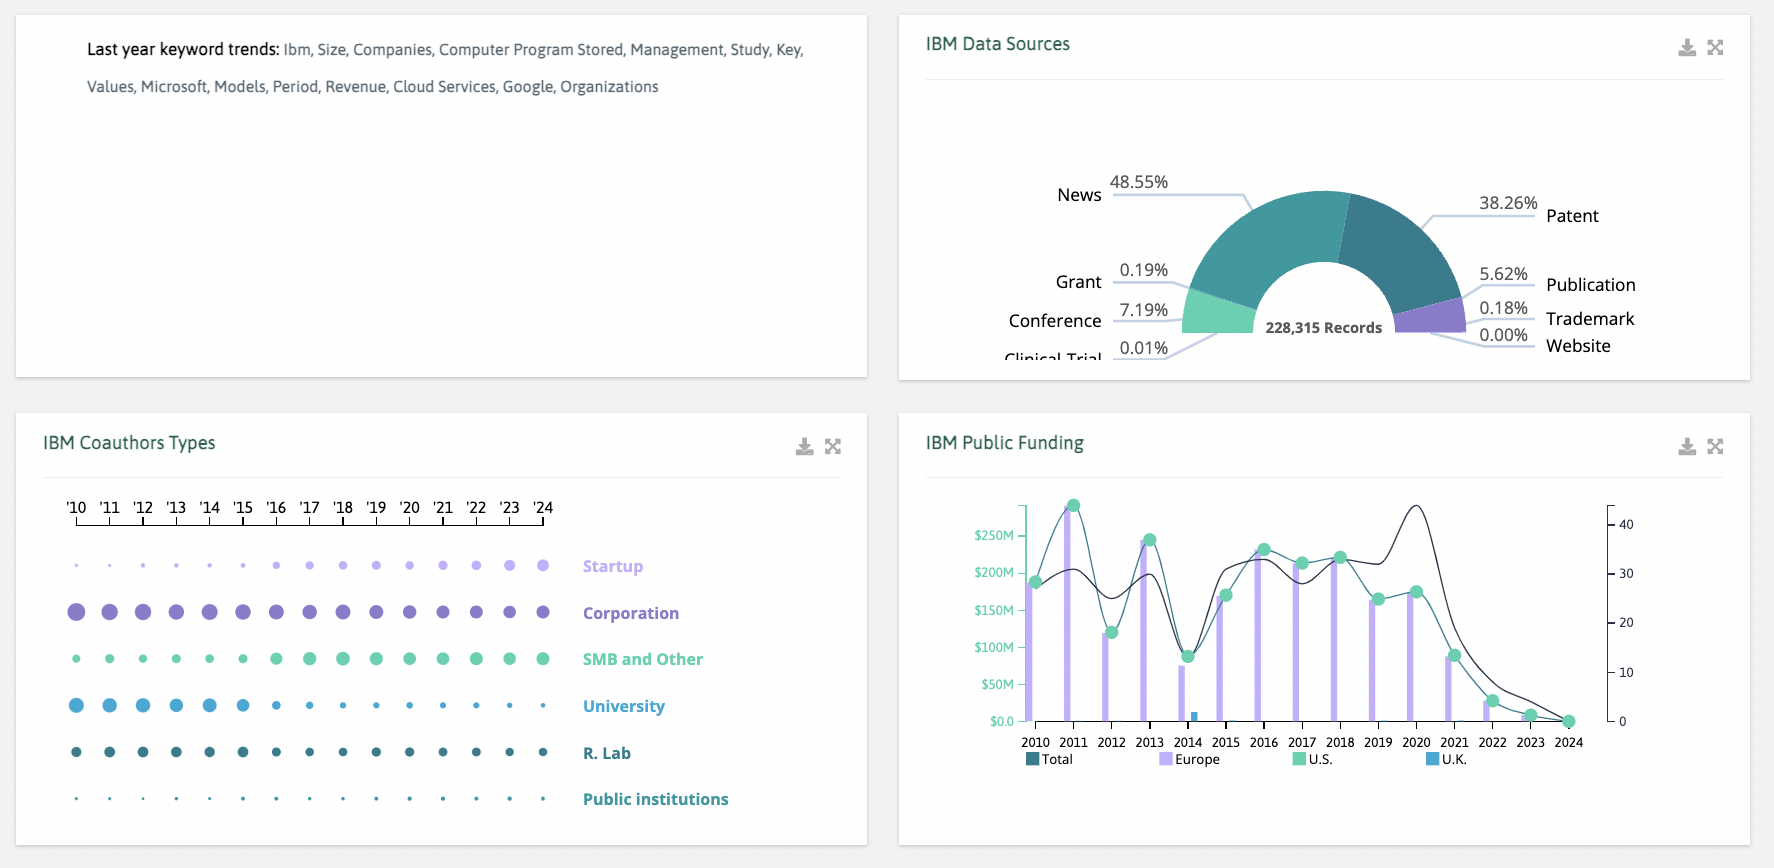
Generated by analysising the data sources contribution to activity in the topic, and by type of organizations active in the topic.
Generated by analysing the top 1,000 documents using clustering techniques, this graph shows the internal trends within the topic you’re investigating based on text information.
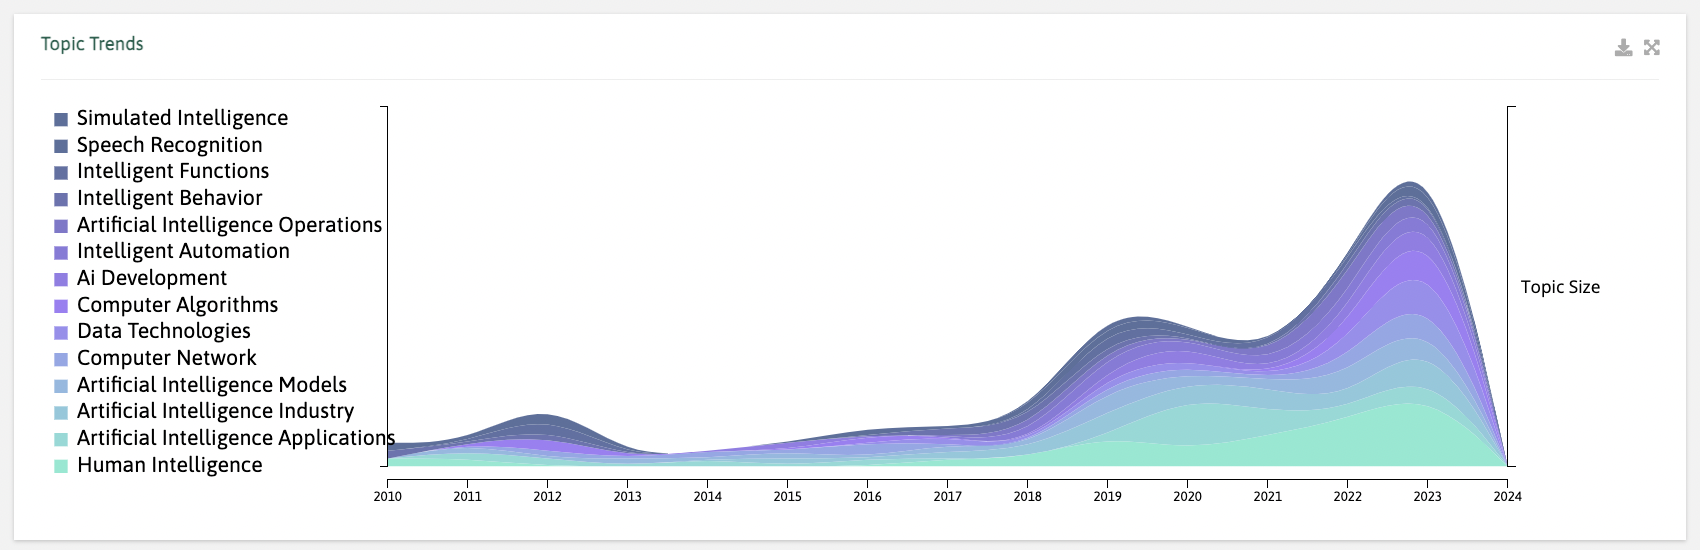
Note: Please keep in mind these trend-graph has not necessarily the same shape as the timeline
, which you can check in the search filters (on the left margin), and is based on ALL references. In the biometric sensors
example below, the timeline looks pretty similar:
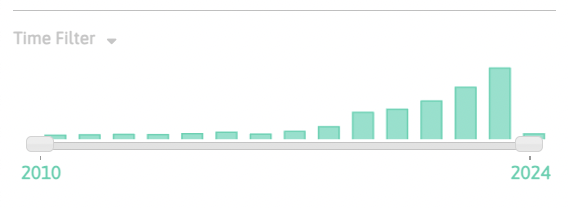
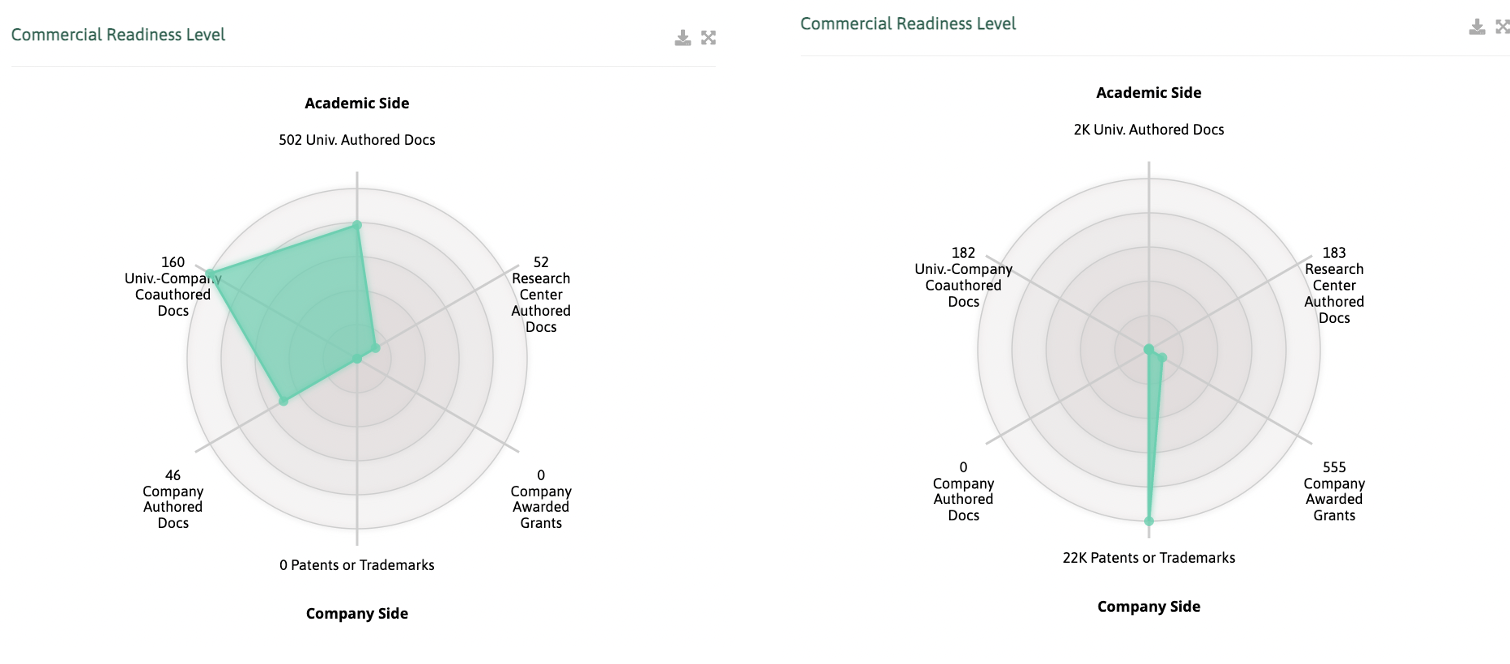
These graphs are very useful to understand how close to market a topic or technology is: the bigger the circles in the academic institutions, the closer to academy - and vice versa: the bigger the circles related to companies, the closest is the topic to the market in the indicated period of time.
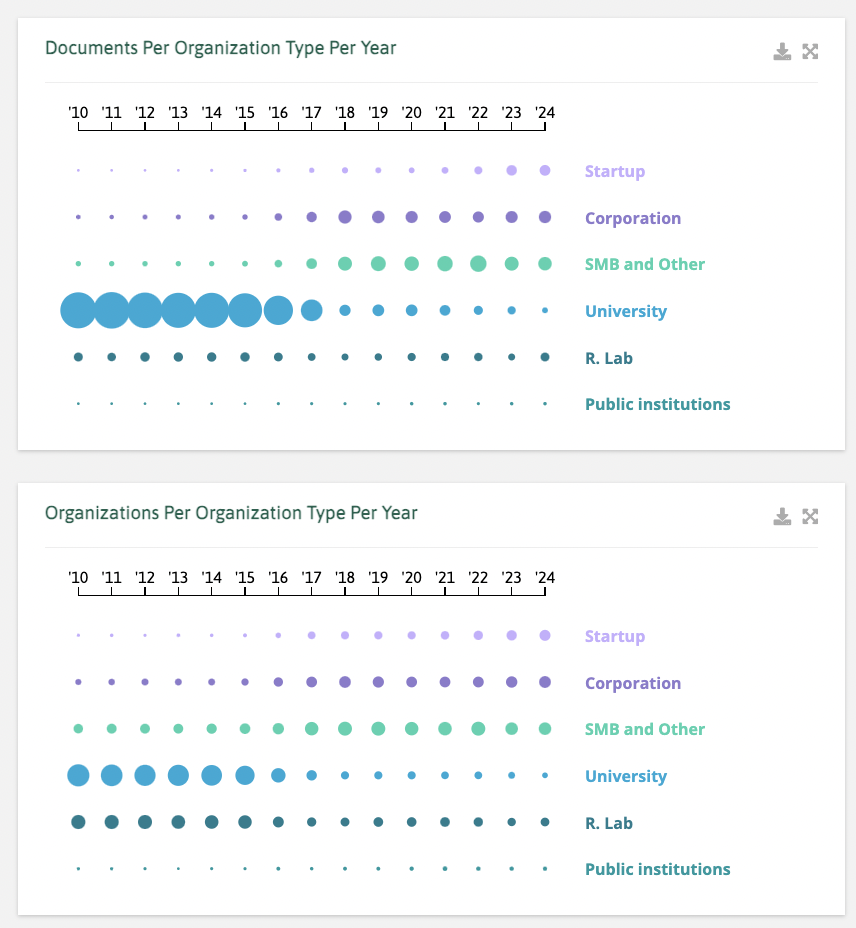
It is a qualitative graph which helps the user understand how active is the industry versus academia, and viceversa. When benchmarking it with other queries such as graphene sensors
(right), one can see how industrial have biometric sensors
(left) as a topic became versus the other niche, still taking off in academic circles, and increasingly in small medium enterprises.
Country distribution is an useful indicator, specially when unexpected countries pop up in the top 5 and top 10. It is also usually relevant to check the first European nation in the chart, and whether USA and China posses the first and second seed they usually have.
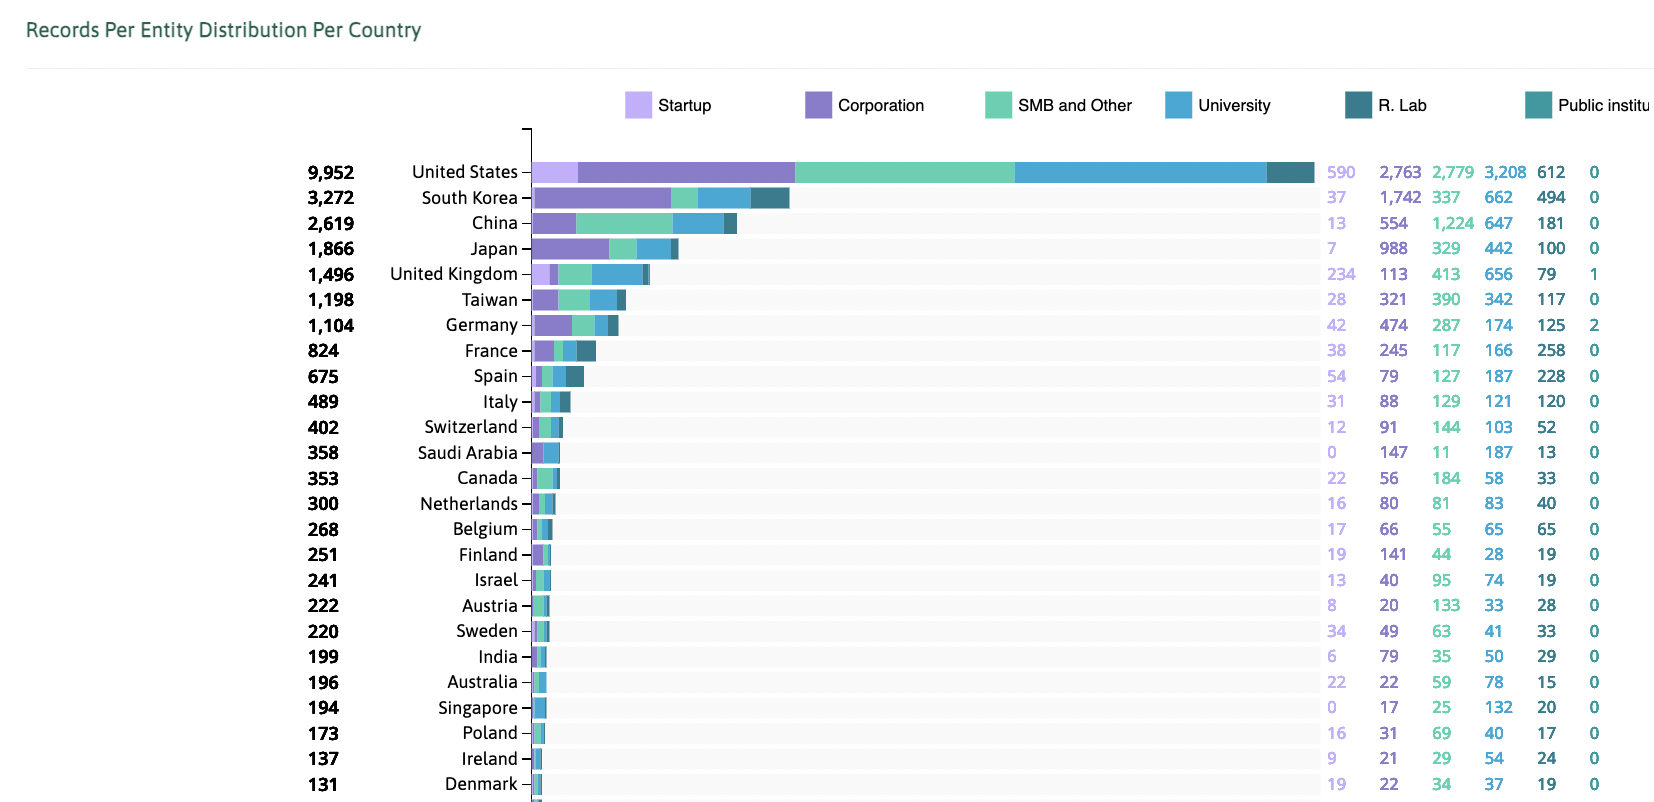
Linknovate.com provides data on EU European Commission (FP7, H2020), USA (SBIR/STTR, NSF, NASA, DOE) and UK (RCUK) grant programs for public and private funding.
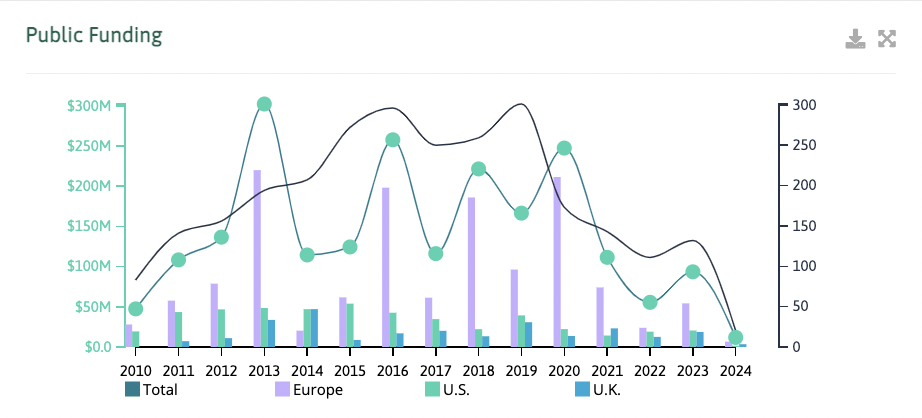
Note: Linknovate provides private funding data (VC deals) and deep patenting activity analysis in our personalized services
(per project). Feel free to contact us to inquire.
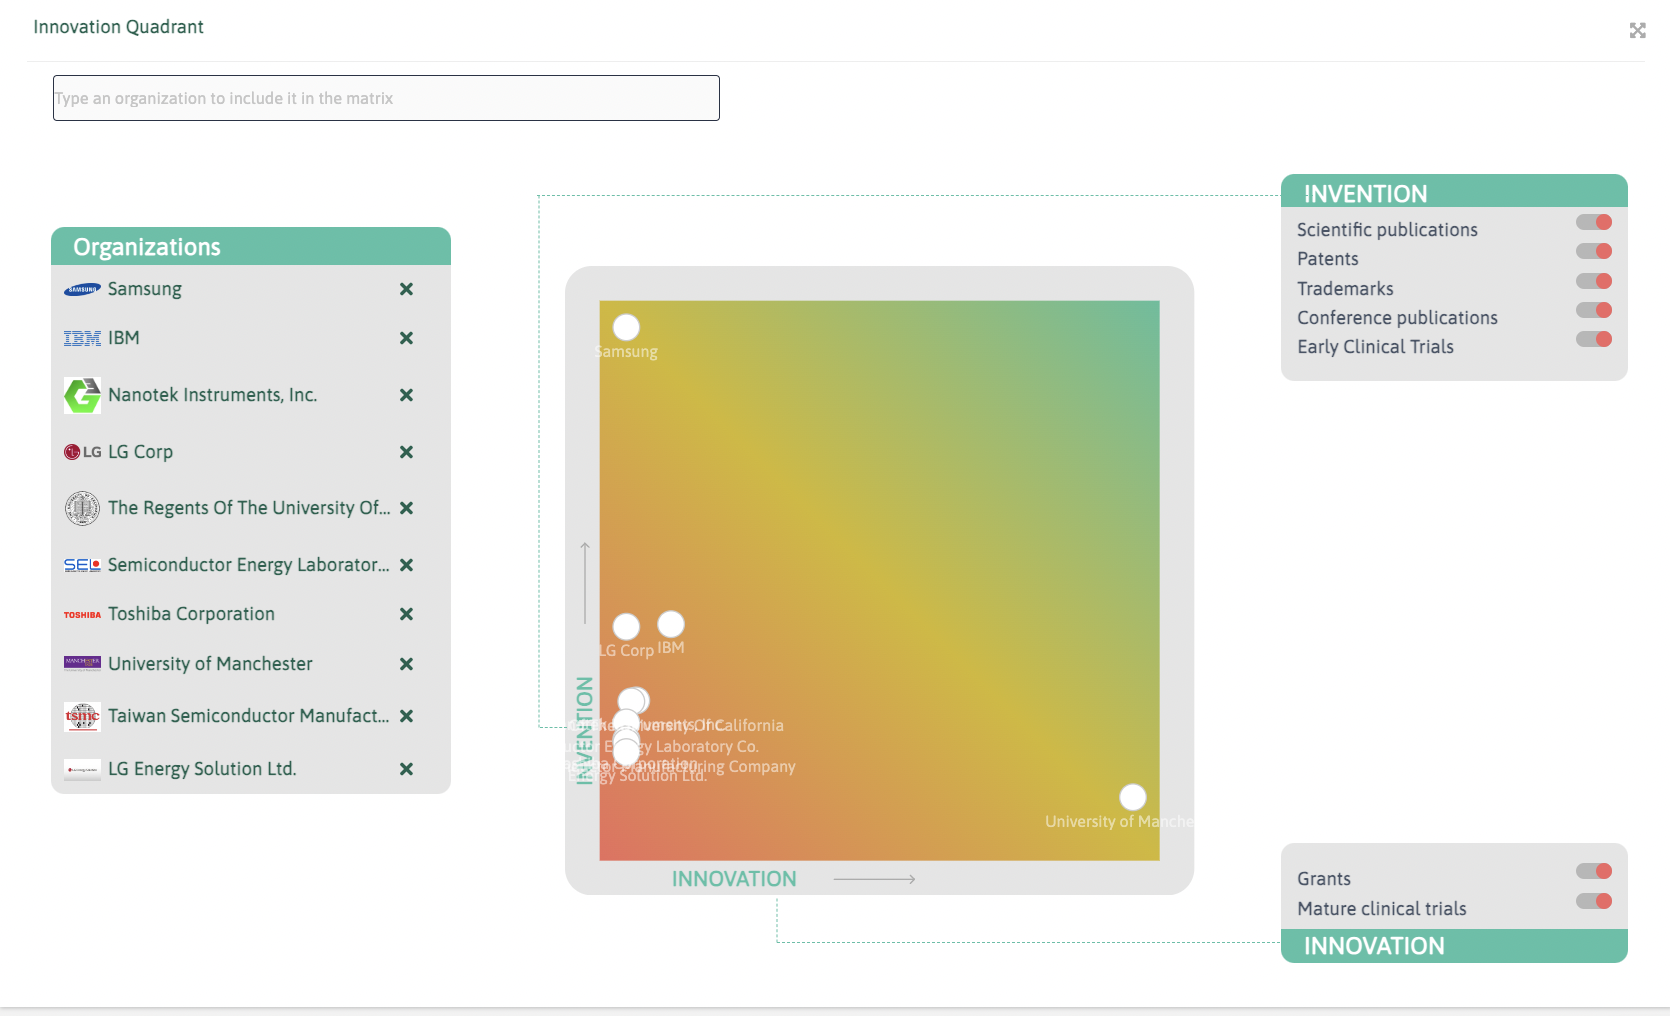
The innovation quadrant gives an outlook on how organisations within the query position themselves in terms of invention and innovation, basing on the number and type of publications they are linked to. You can add any organisation of your choice through the bar on the top of the graph, and filter by type of records.
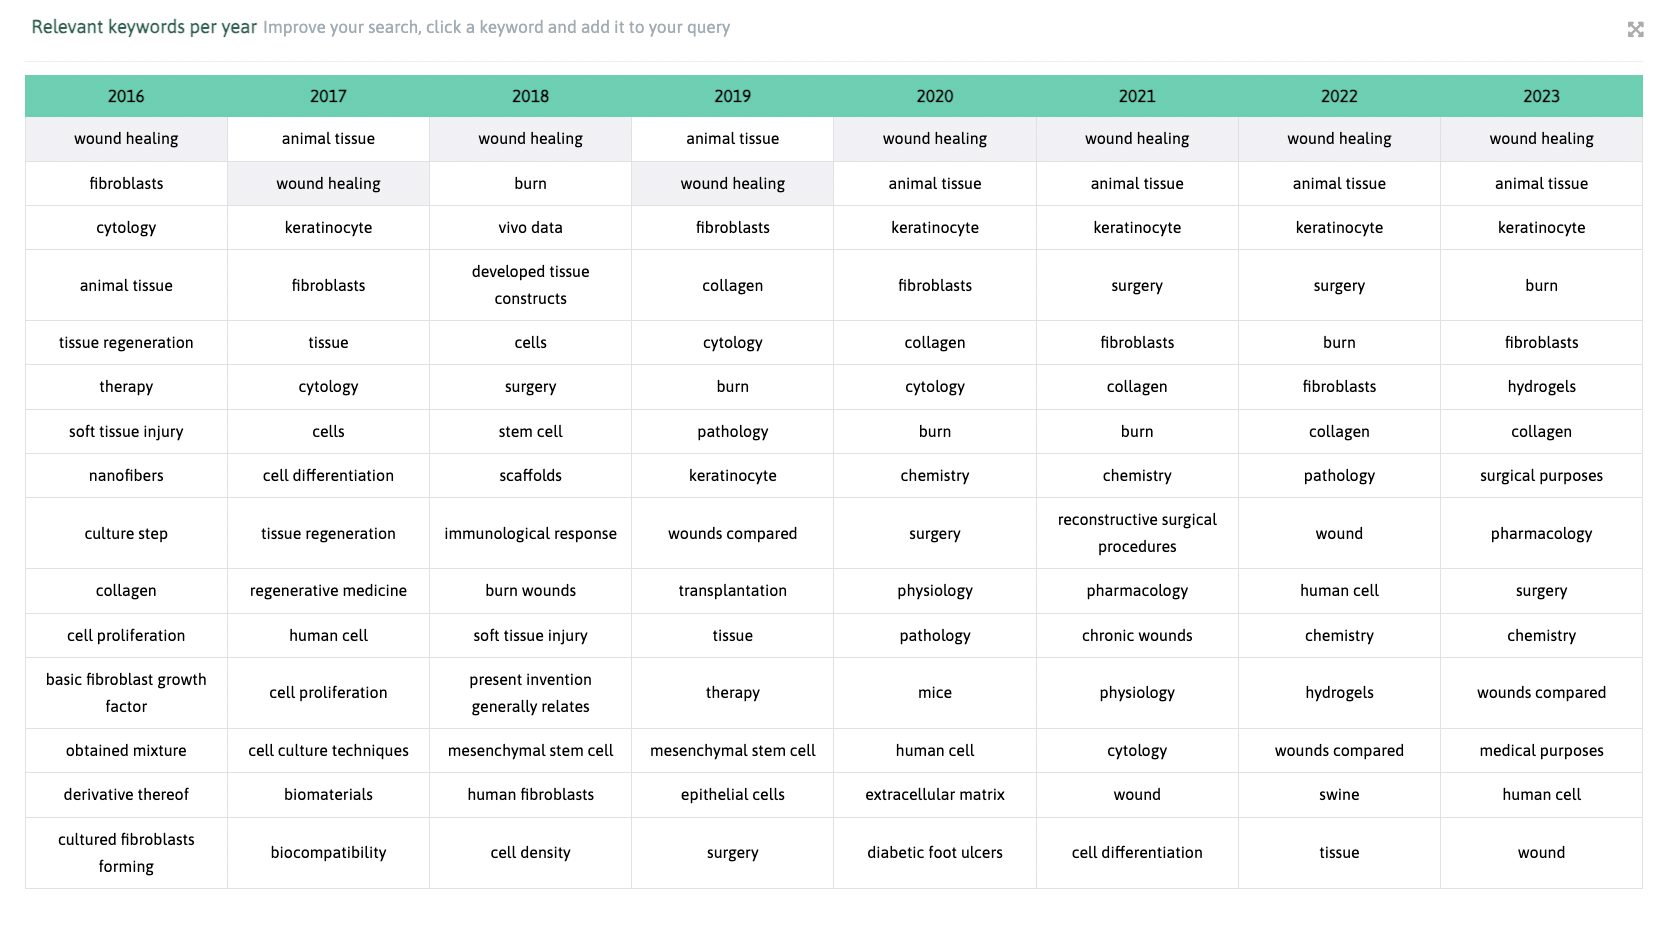
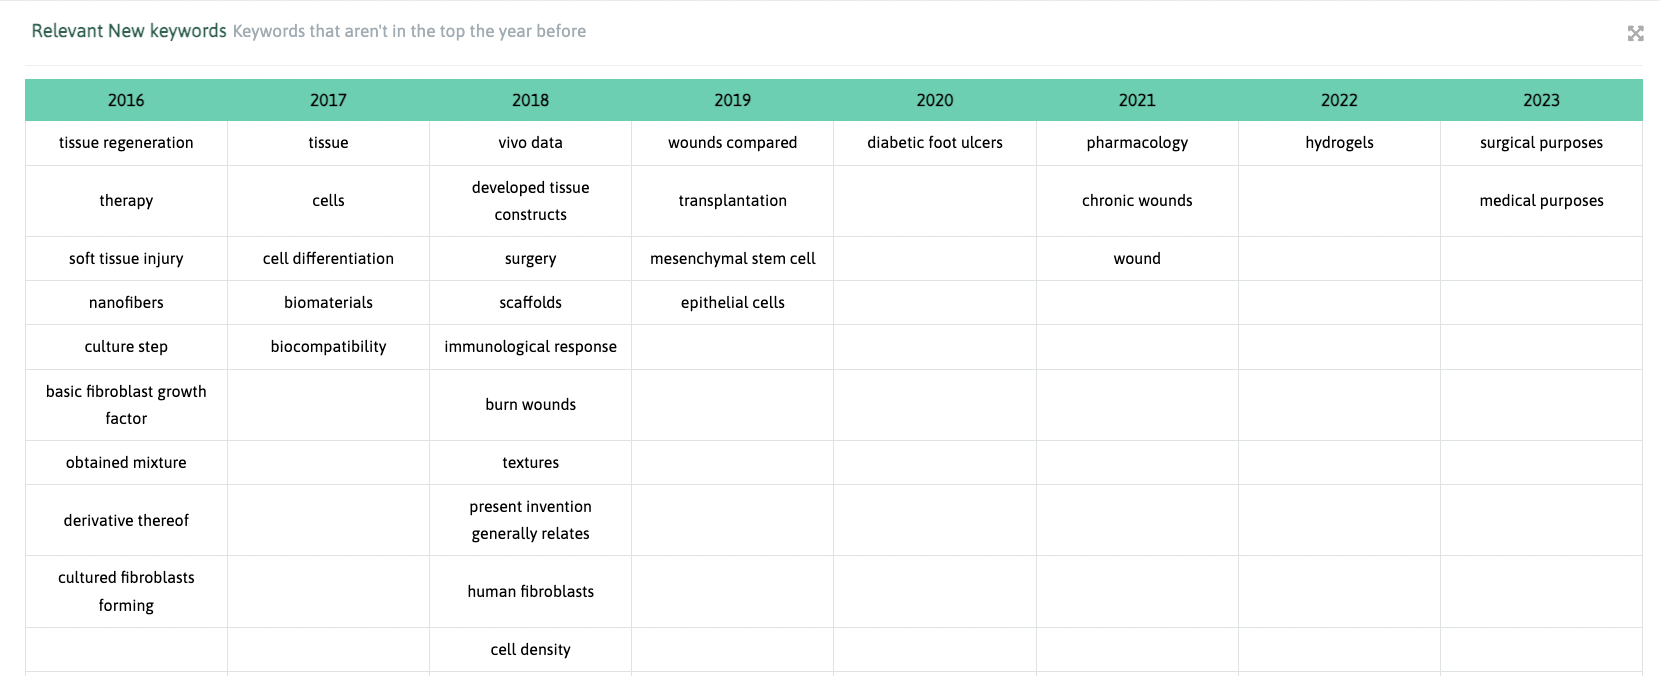
The table shows the most important author-annotated keywords and software-extracted keywords in the documents for each of the years in the timeline (2016-present). In the example, we are looking for keywords related to artificial skin applications in healthcare.
The table with new relevant key words per year works in a similar way, highlighting the new relevant keyword for each year - i.e. keywords that were not relevant or used in the previous years. The example shows a search about quantum cryptography.
Last but not least, you can also create custom charts through the button you find on top of the data analytics page.
Note 1: Do not forget you can generate a report with most of these graphs automatically exported into a perfectly casted powerpoint presentation, it takes 1min. Check Generate Report
feature.
Note 2: Linknovate provides further in-depth reporting capabilities to our enterprise clients and to new clients on a project basis. Private funding data (VC deals), deep patenting activity analysis and competitor tracking are provided under our personalized services
. Feel free to contact us to enquiry: info@linknovate.com
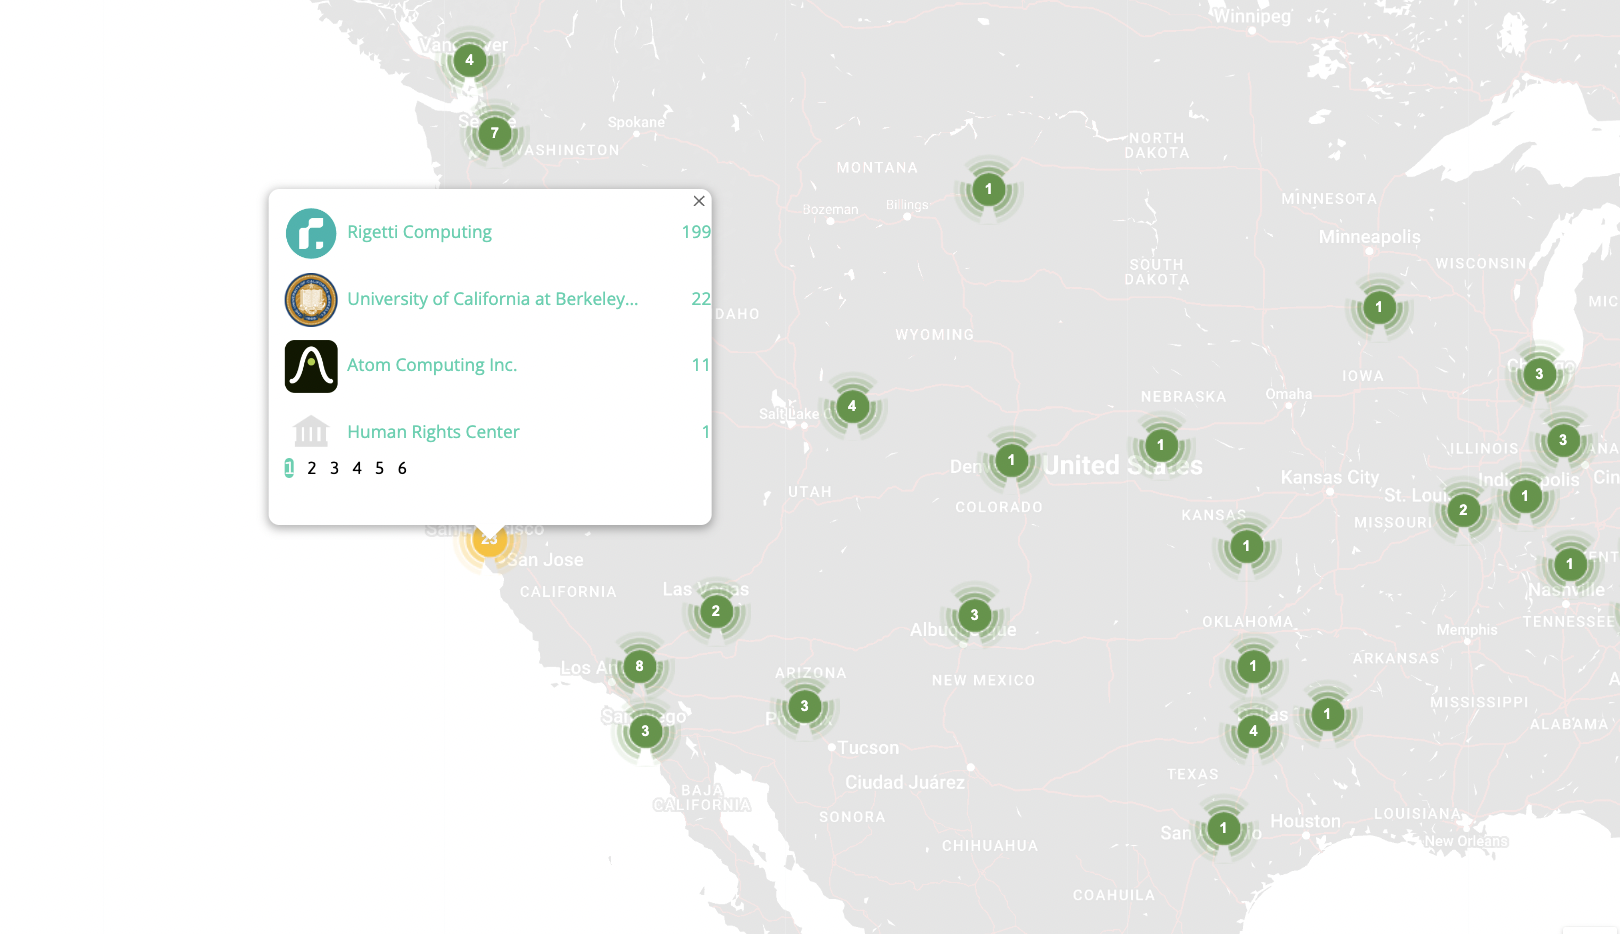
The map is a feature to visualize how organisations active in the topic of our query are distributed worldwide.
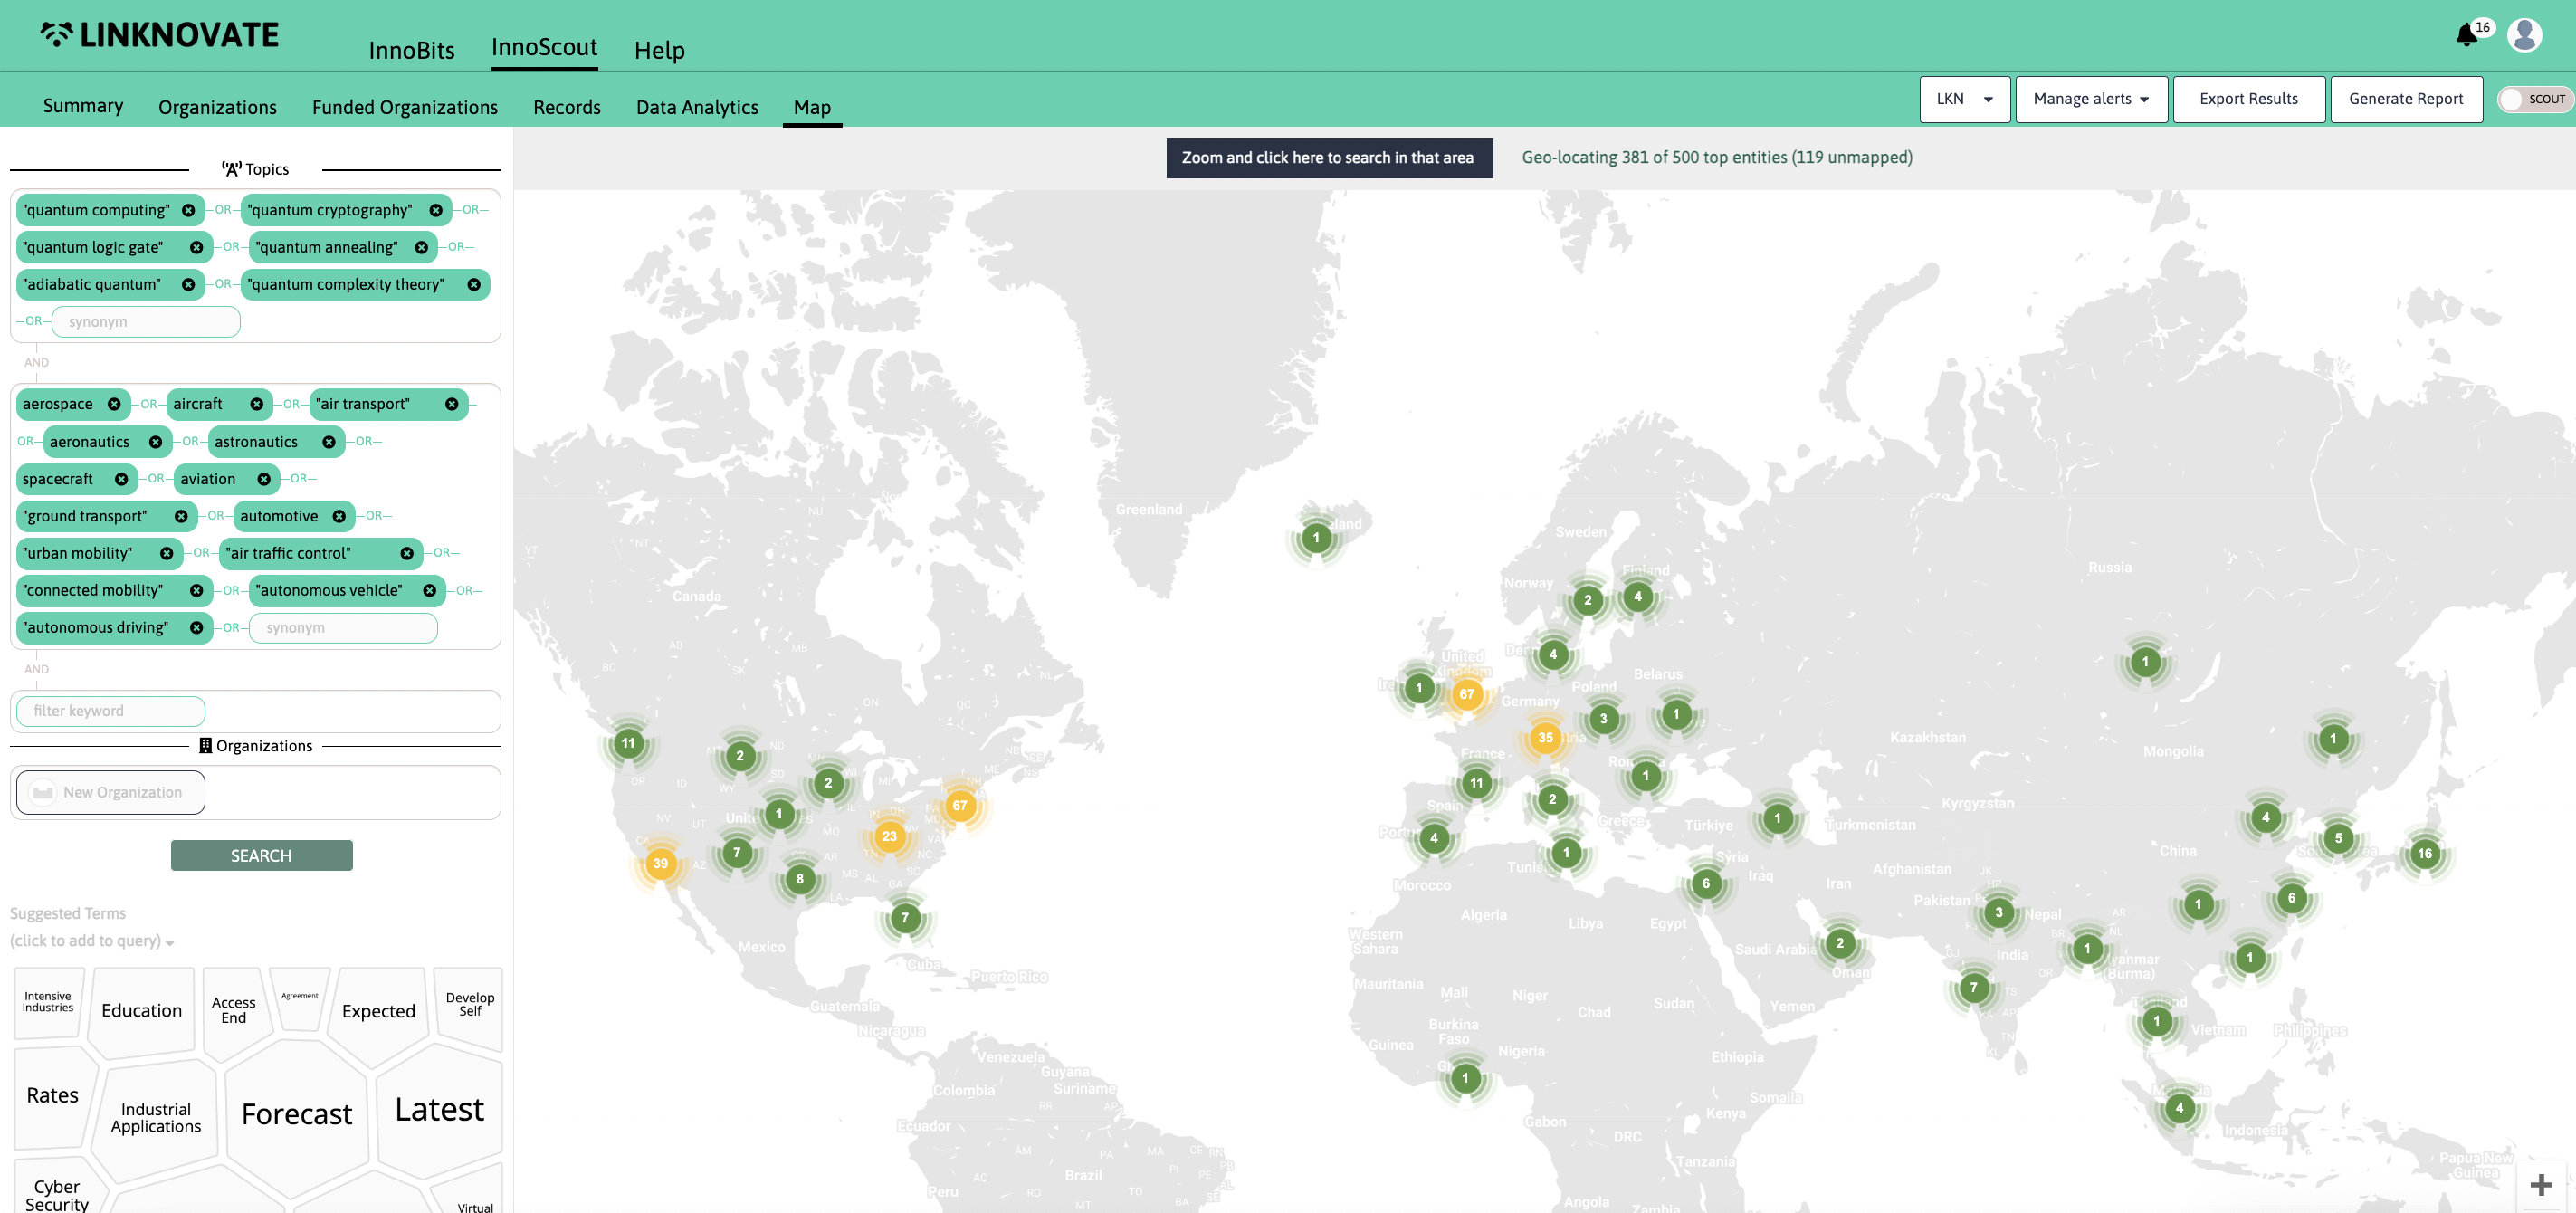
The map indicates the number of organisations in each area, and allows users to click to check the name of the organisations and go to their profile.
Once your query is set, you can check two kinds of organizations lists: “Organizations” and “Funded organizations”. The first one shows a list including all of the organizations related to the query, while the second one only shows the organizations with funding information.
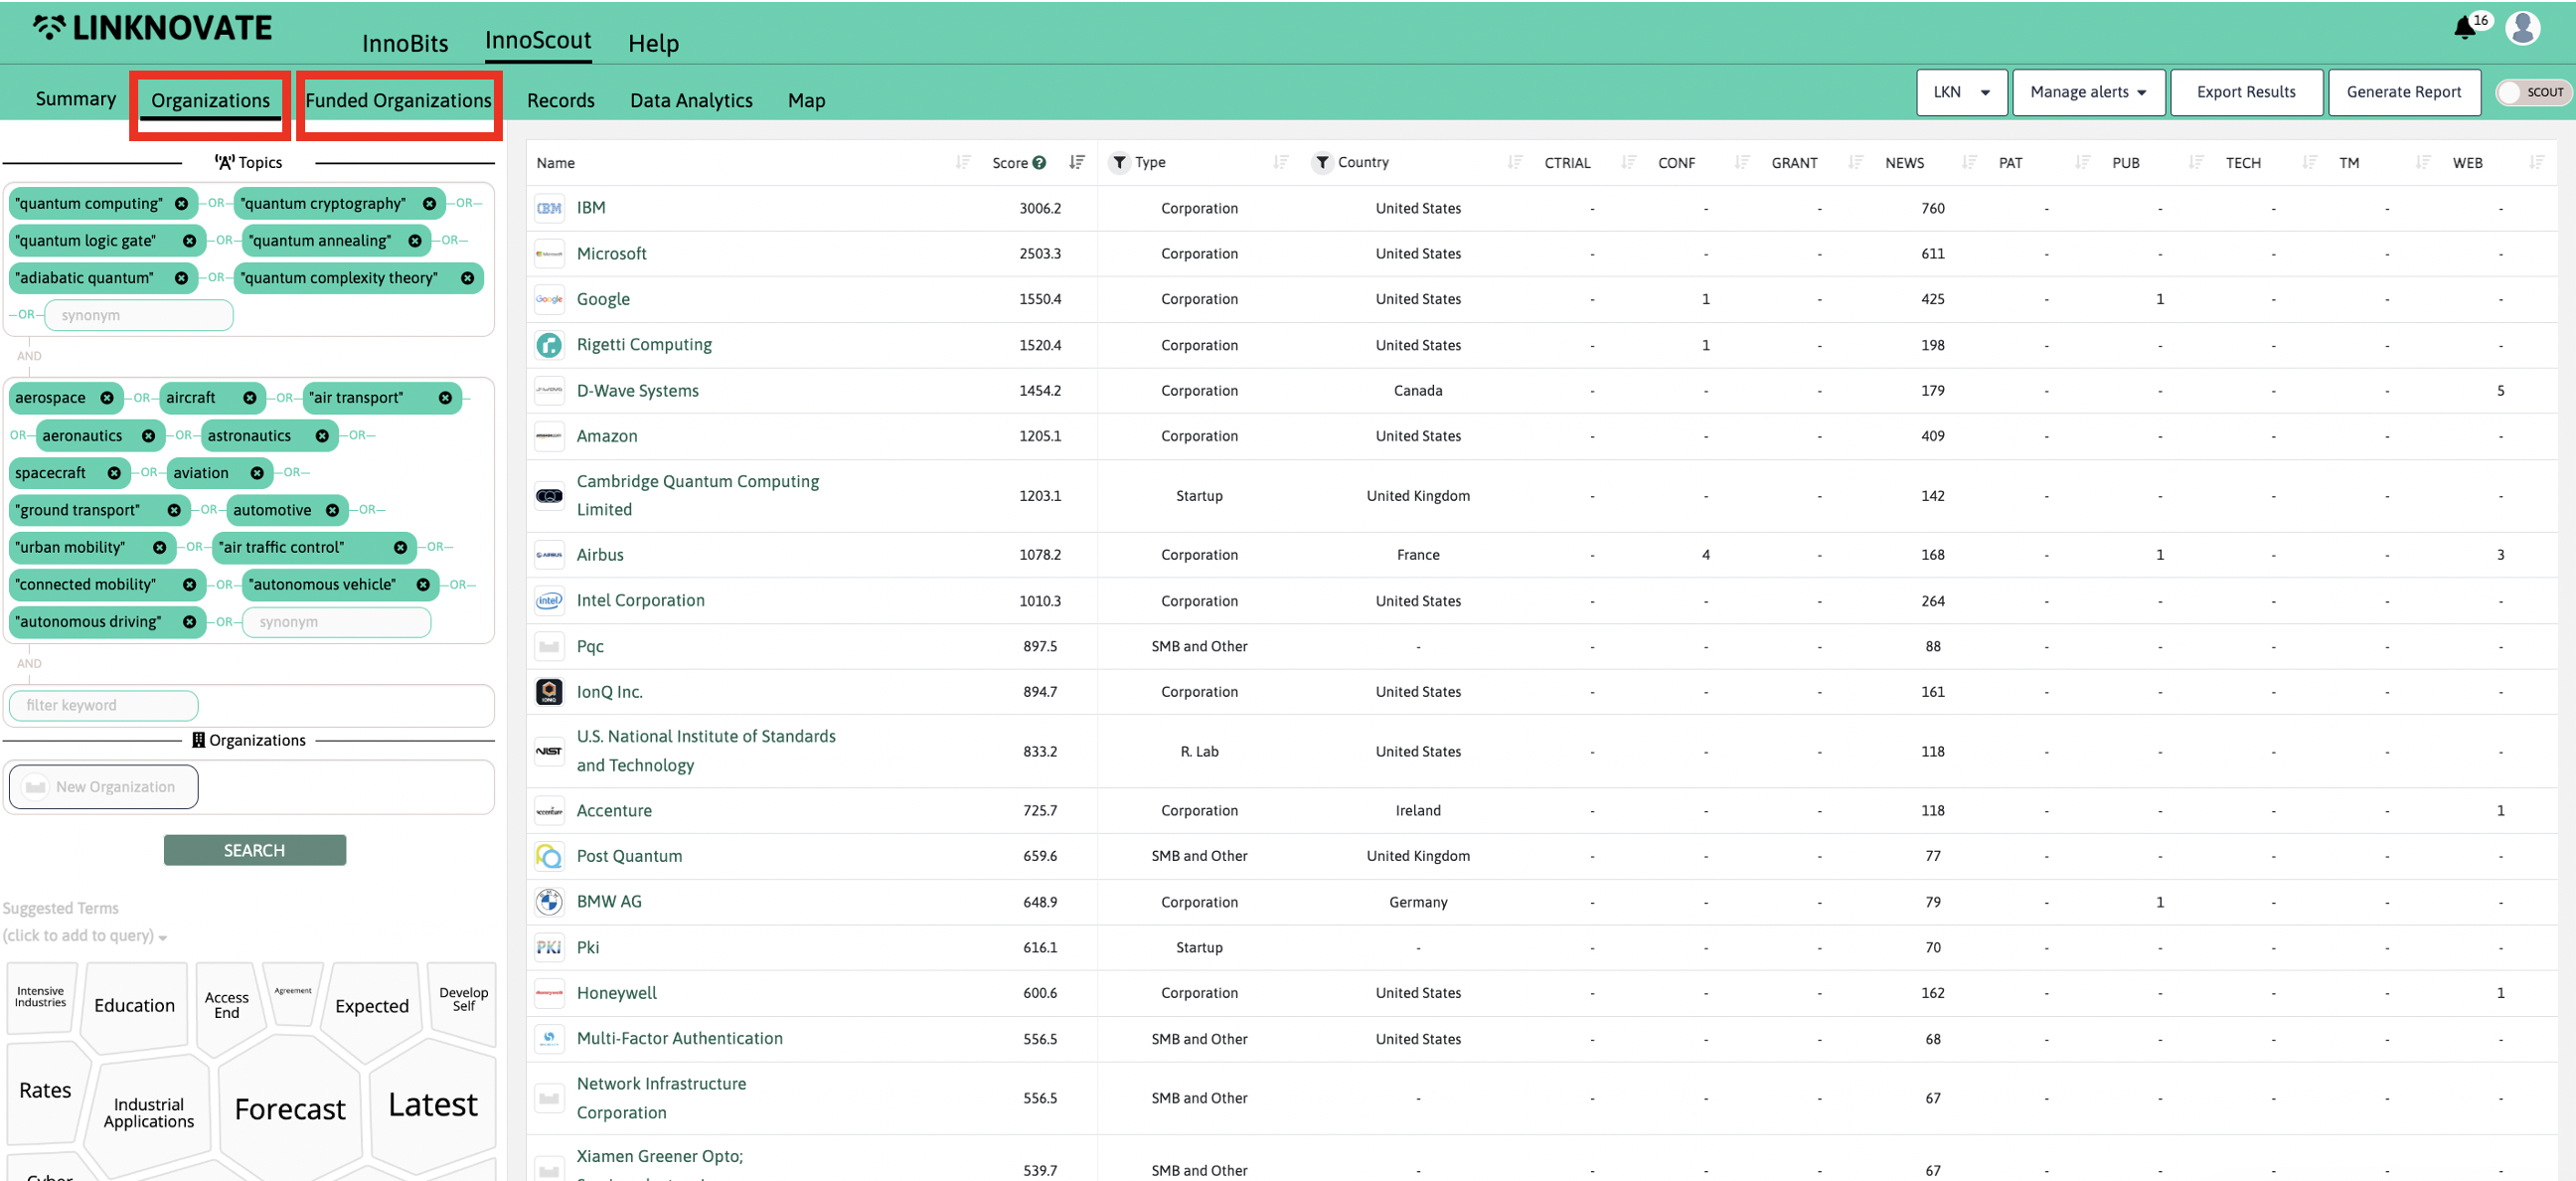
The list is ordered according to the relevance score by default, which is indicated next to the name of the org. The order of the list can be changed filtering by any of the values present on the graph - type of company, country, type and number of records simply clicking on the table.
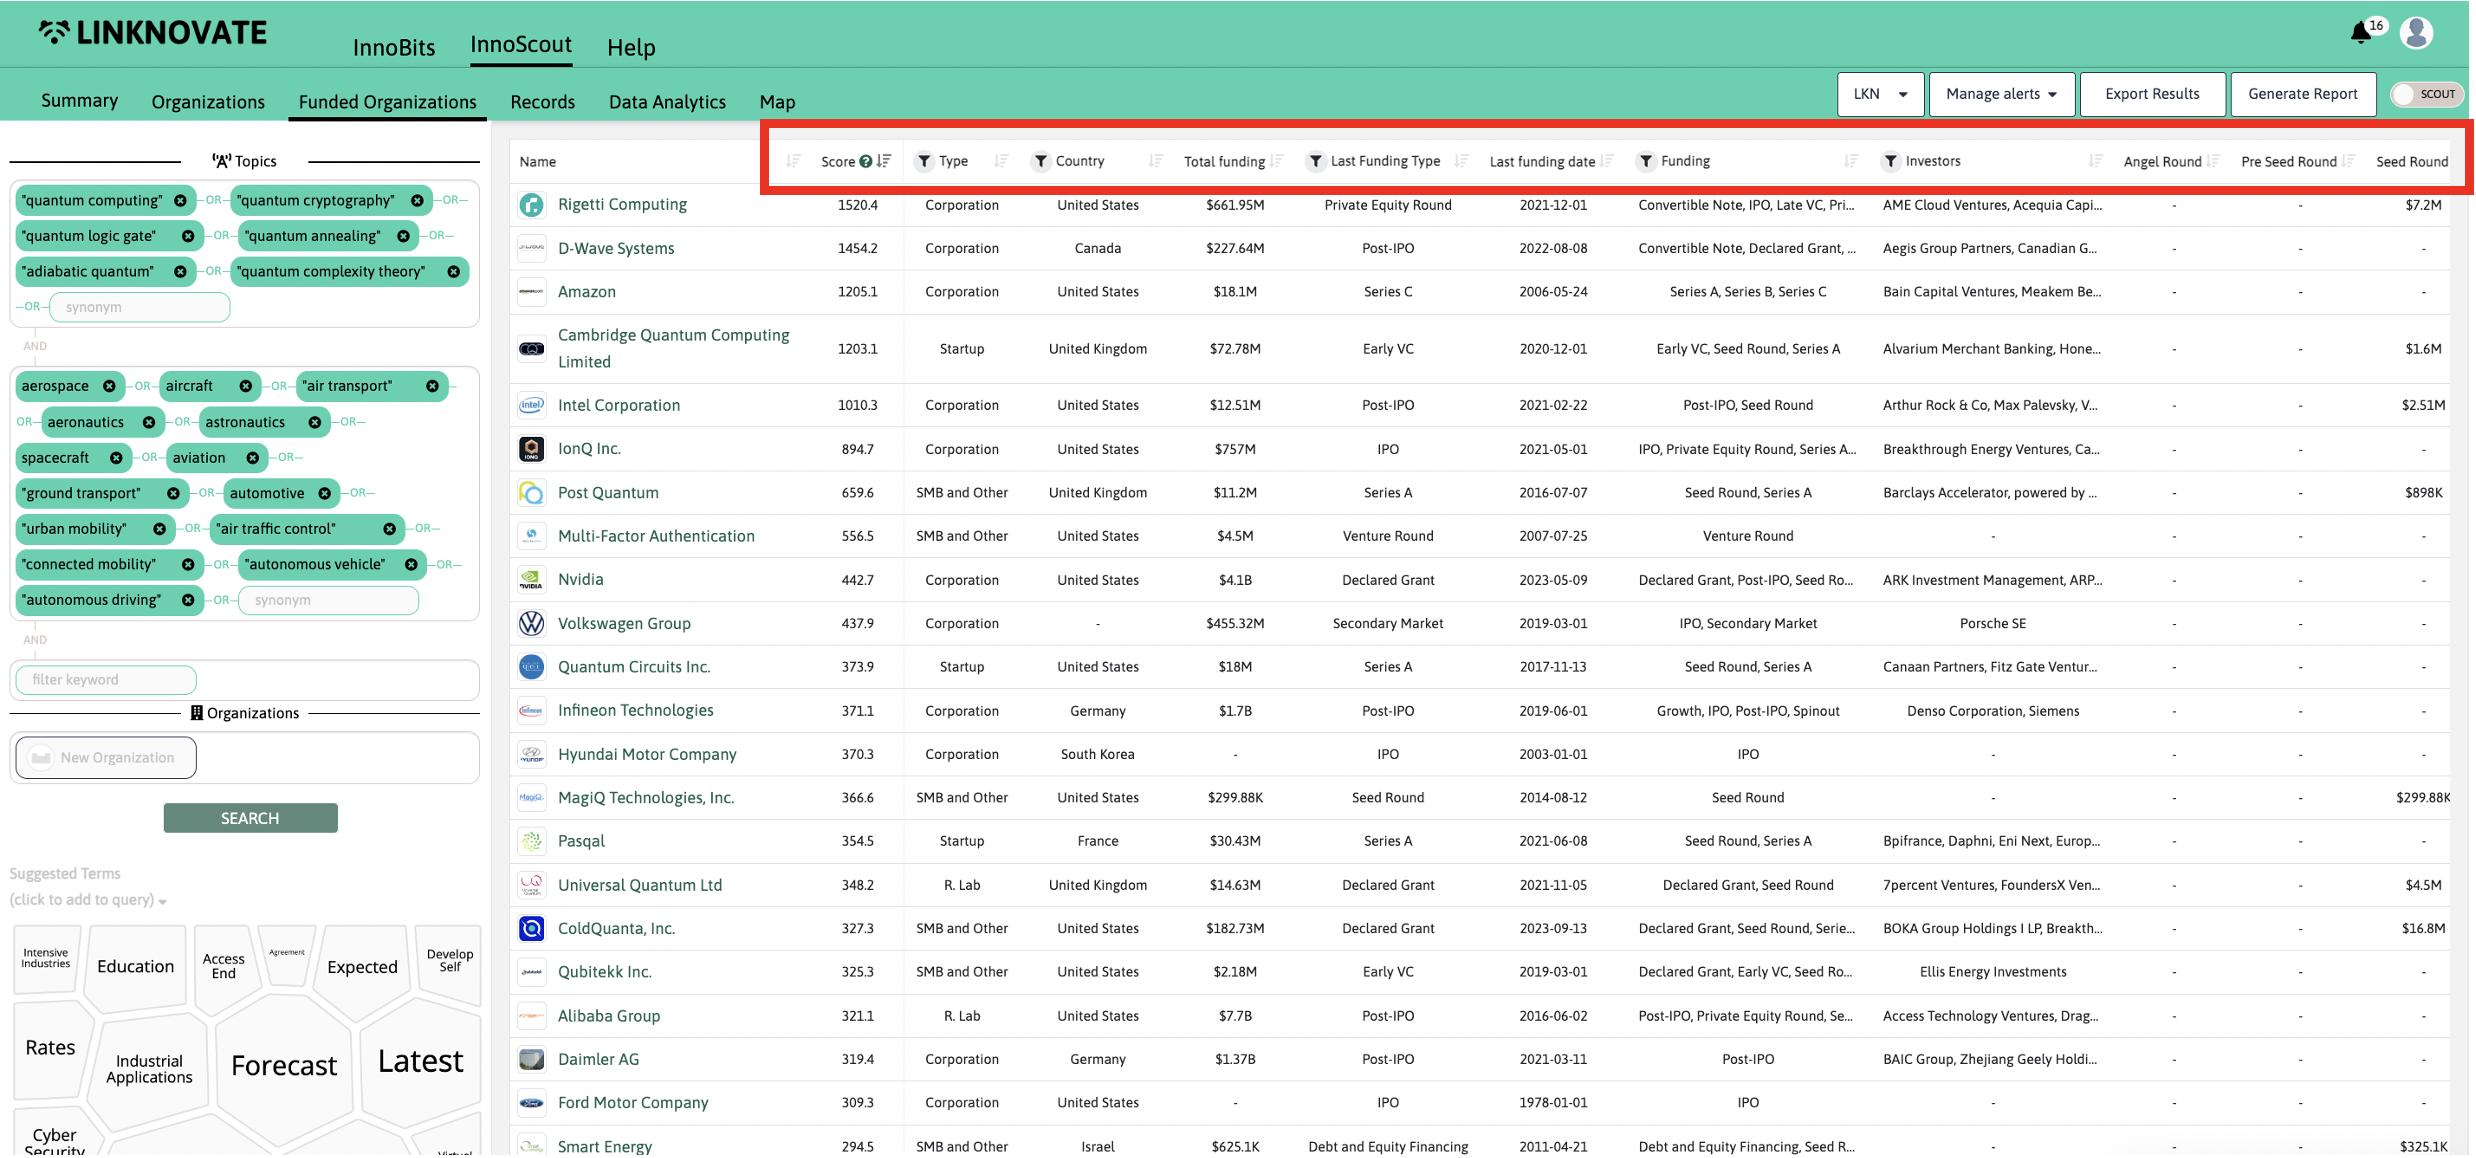
The funded organization list works in the same way, but organizations can be ordered according to different values which include total funding, last funding type or date, type of round, and investor’s name.
Clicking on the name of any organization on the list, it is possible to check the organization’s Linknovate profile linked to the query. The profile shows basic information regarding the org, and the records that are linked to the query and the organization. In this profile, you can filter records by type and by year, as well as change or delete the query keywords to navigate through the company’s records.
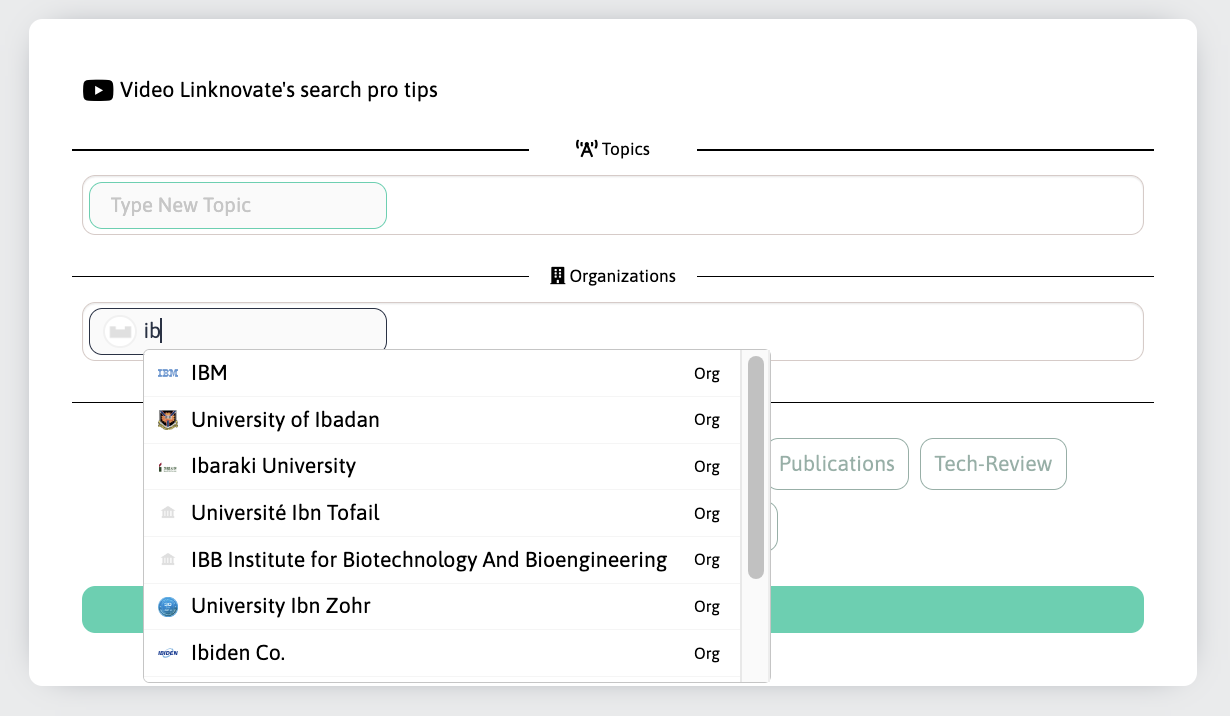
Another way to check an organization’s profile is to simply search for the organization through the InnoScout Search.
Now that we know how to reach an organization’s profile, let’s have a closer look at its features and components.
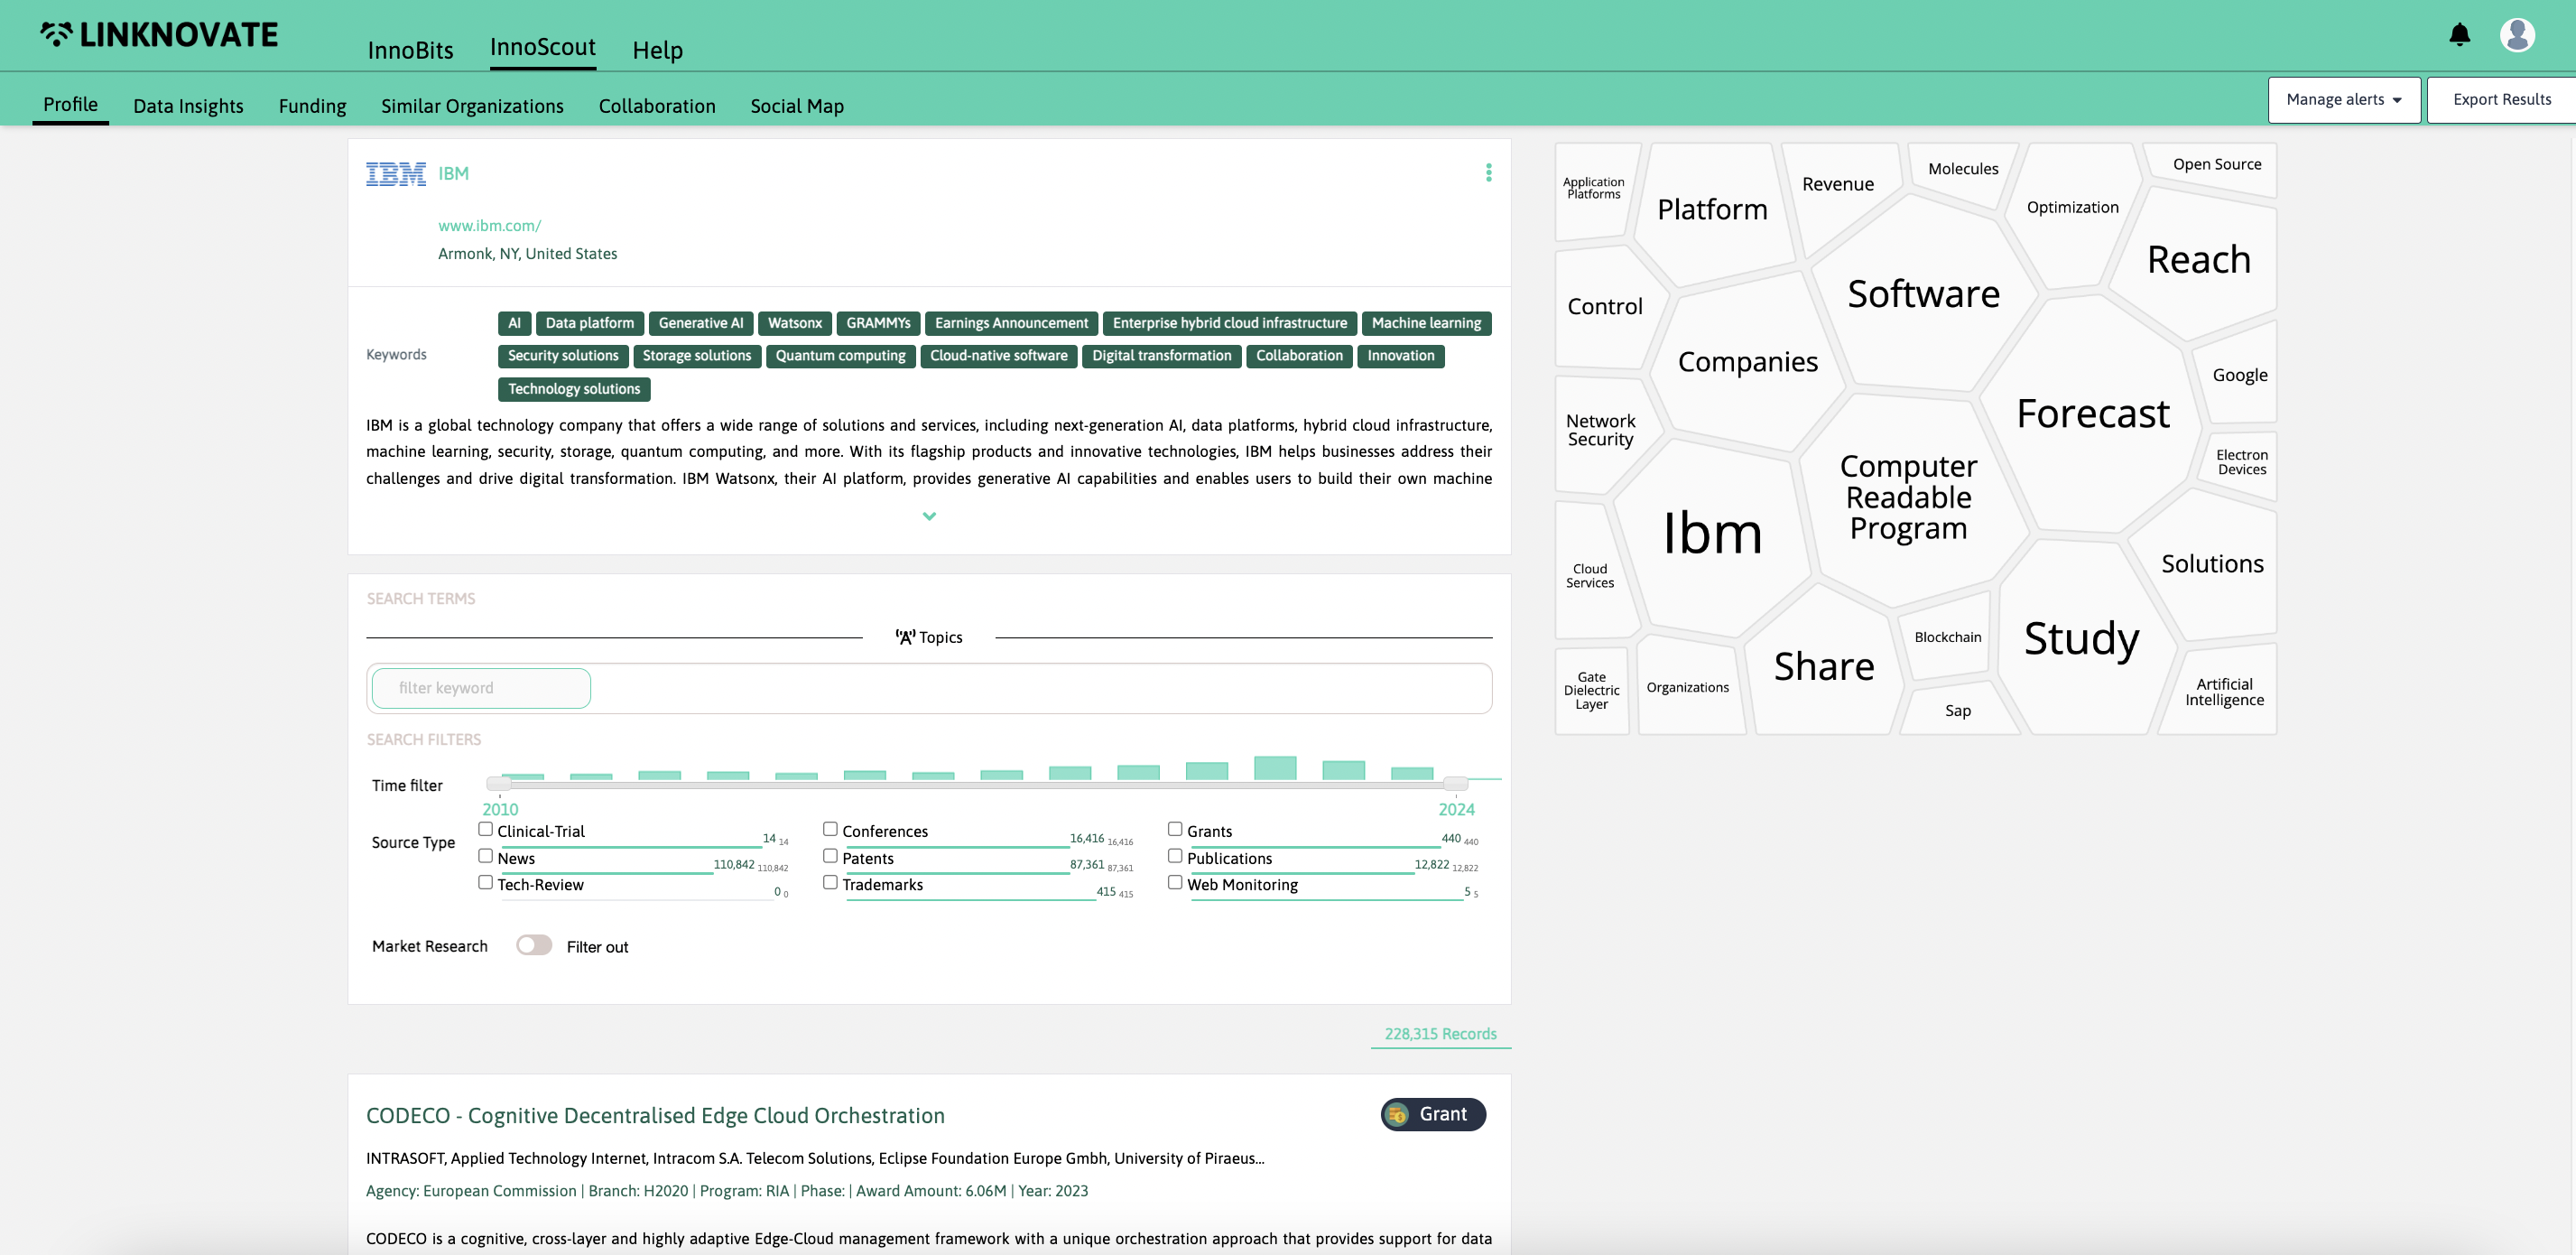
Organizations profiles also have a data insights section, where you can find visual data about key words, type of documents and organizations linked to the organization, funding, etc.
Scrolling down in the “Data Insights” page, you can compare the organization with other entities through a simple key-word search.
Linknovate is capable of generating graphs dynamically using all the information you are interested in (that you have previously filtered), aggregating it and showing it in a visual, easy-to-understand way.
When you do a search within an entity profile, Linknovate generates both below visualizations by default, using the search parameters. In the example, we show the graphs automatically generated for an Artificial Intelligence query within Microsoft's entity profile.
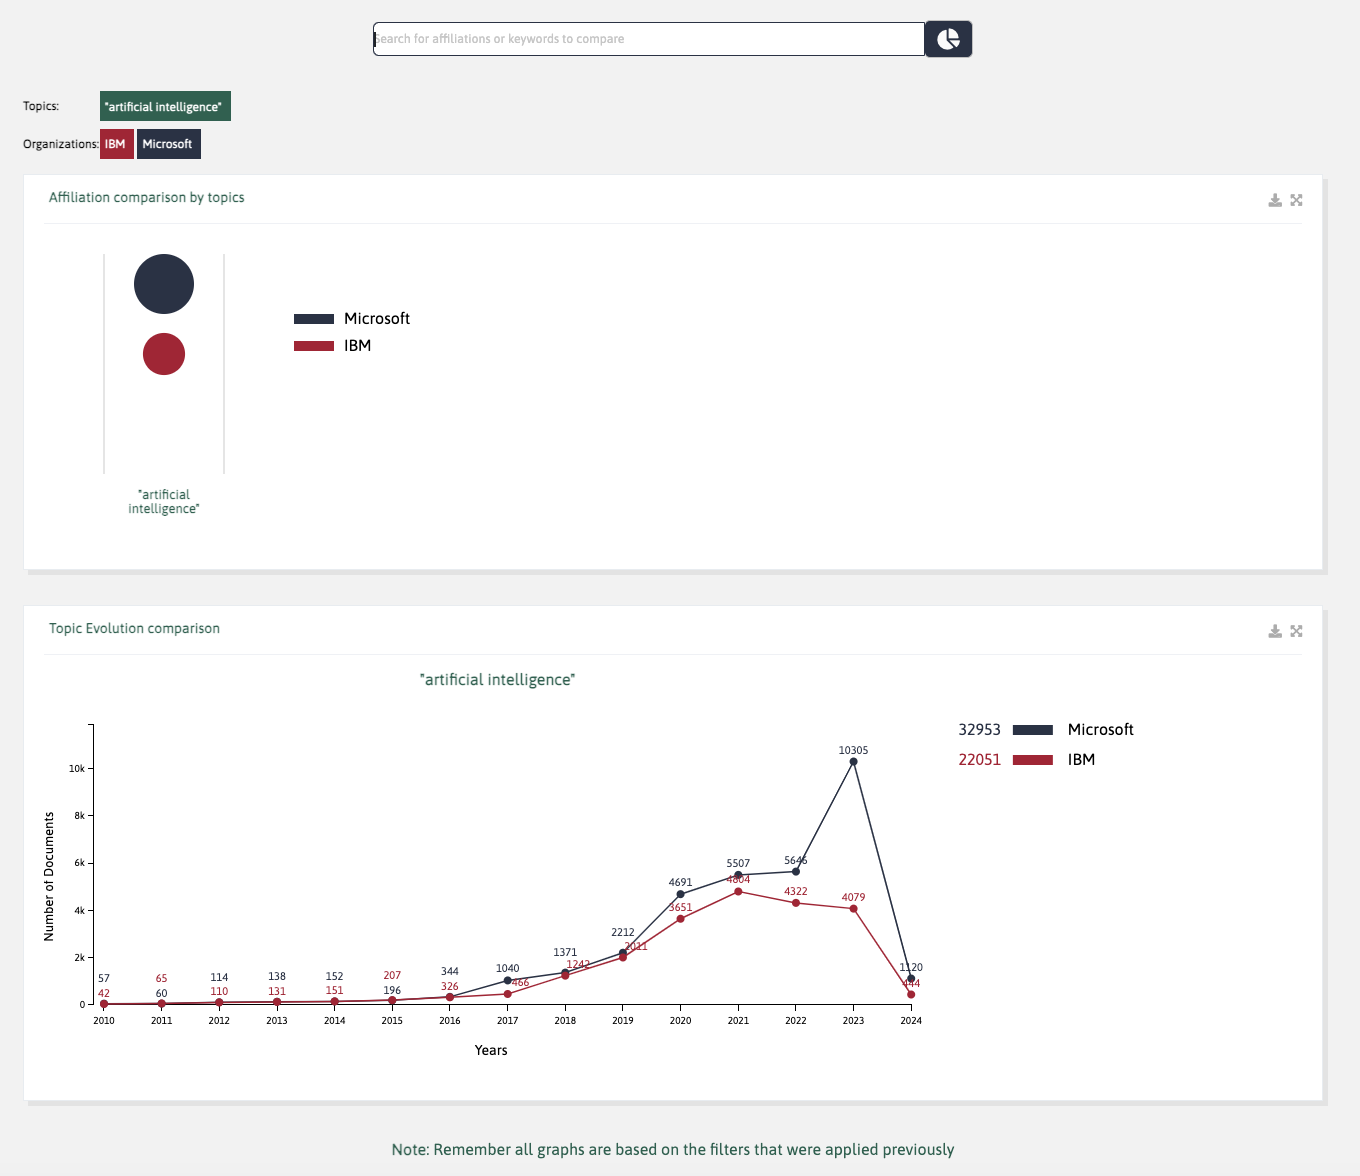
The Affiliation Comparison by Topics graph represents, in a visual way, the entities' performance since 2010 for the topics you are searching and based on their number of works.
The Topic Evolution Comparison graph represents the evolution of an entity's work on a given topic. It shows the number of records issued per year, making it easy to figure out their strategy regarding a specific topic.
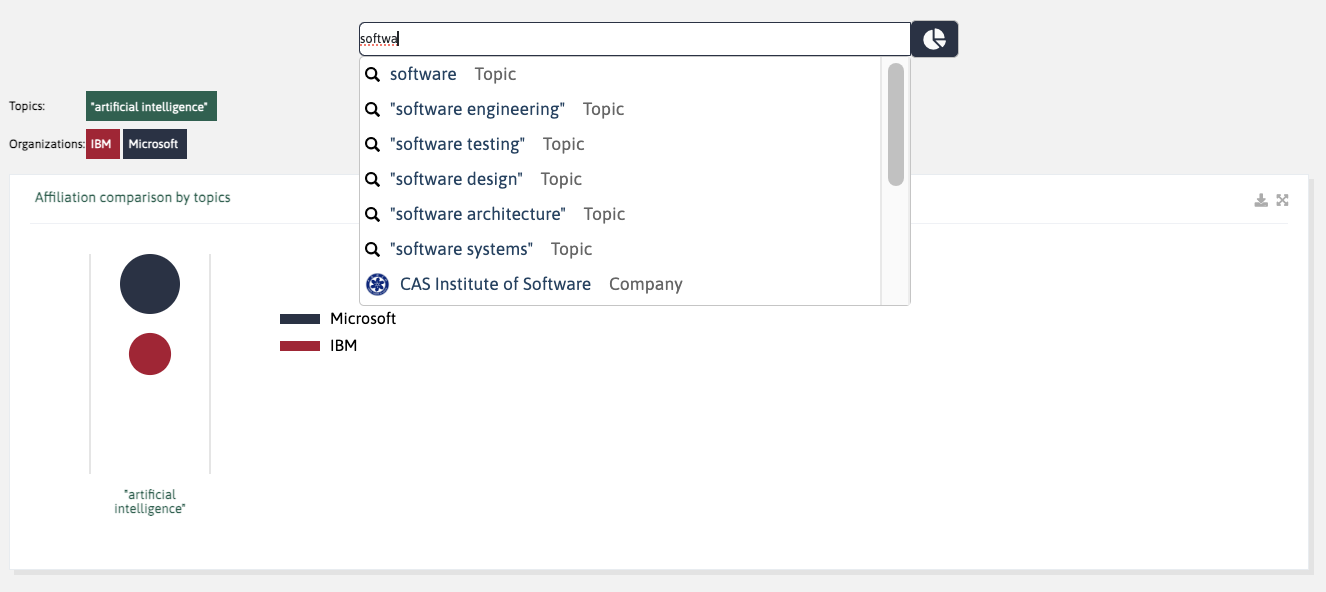
From here on, you can add new topics (keywords) or entities using the search box provided. You will dynamically add them to both graphs; an easy, quick way of creating the graphs you need for your analysis.
As for comparing different topic's evolutions, it is the same process than comparing entities. The platform generates a new graph, above the previous one, that shows the topic's evolution of the entities you want to compare.
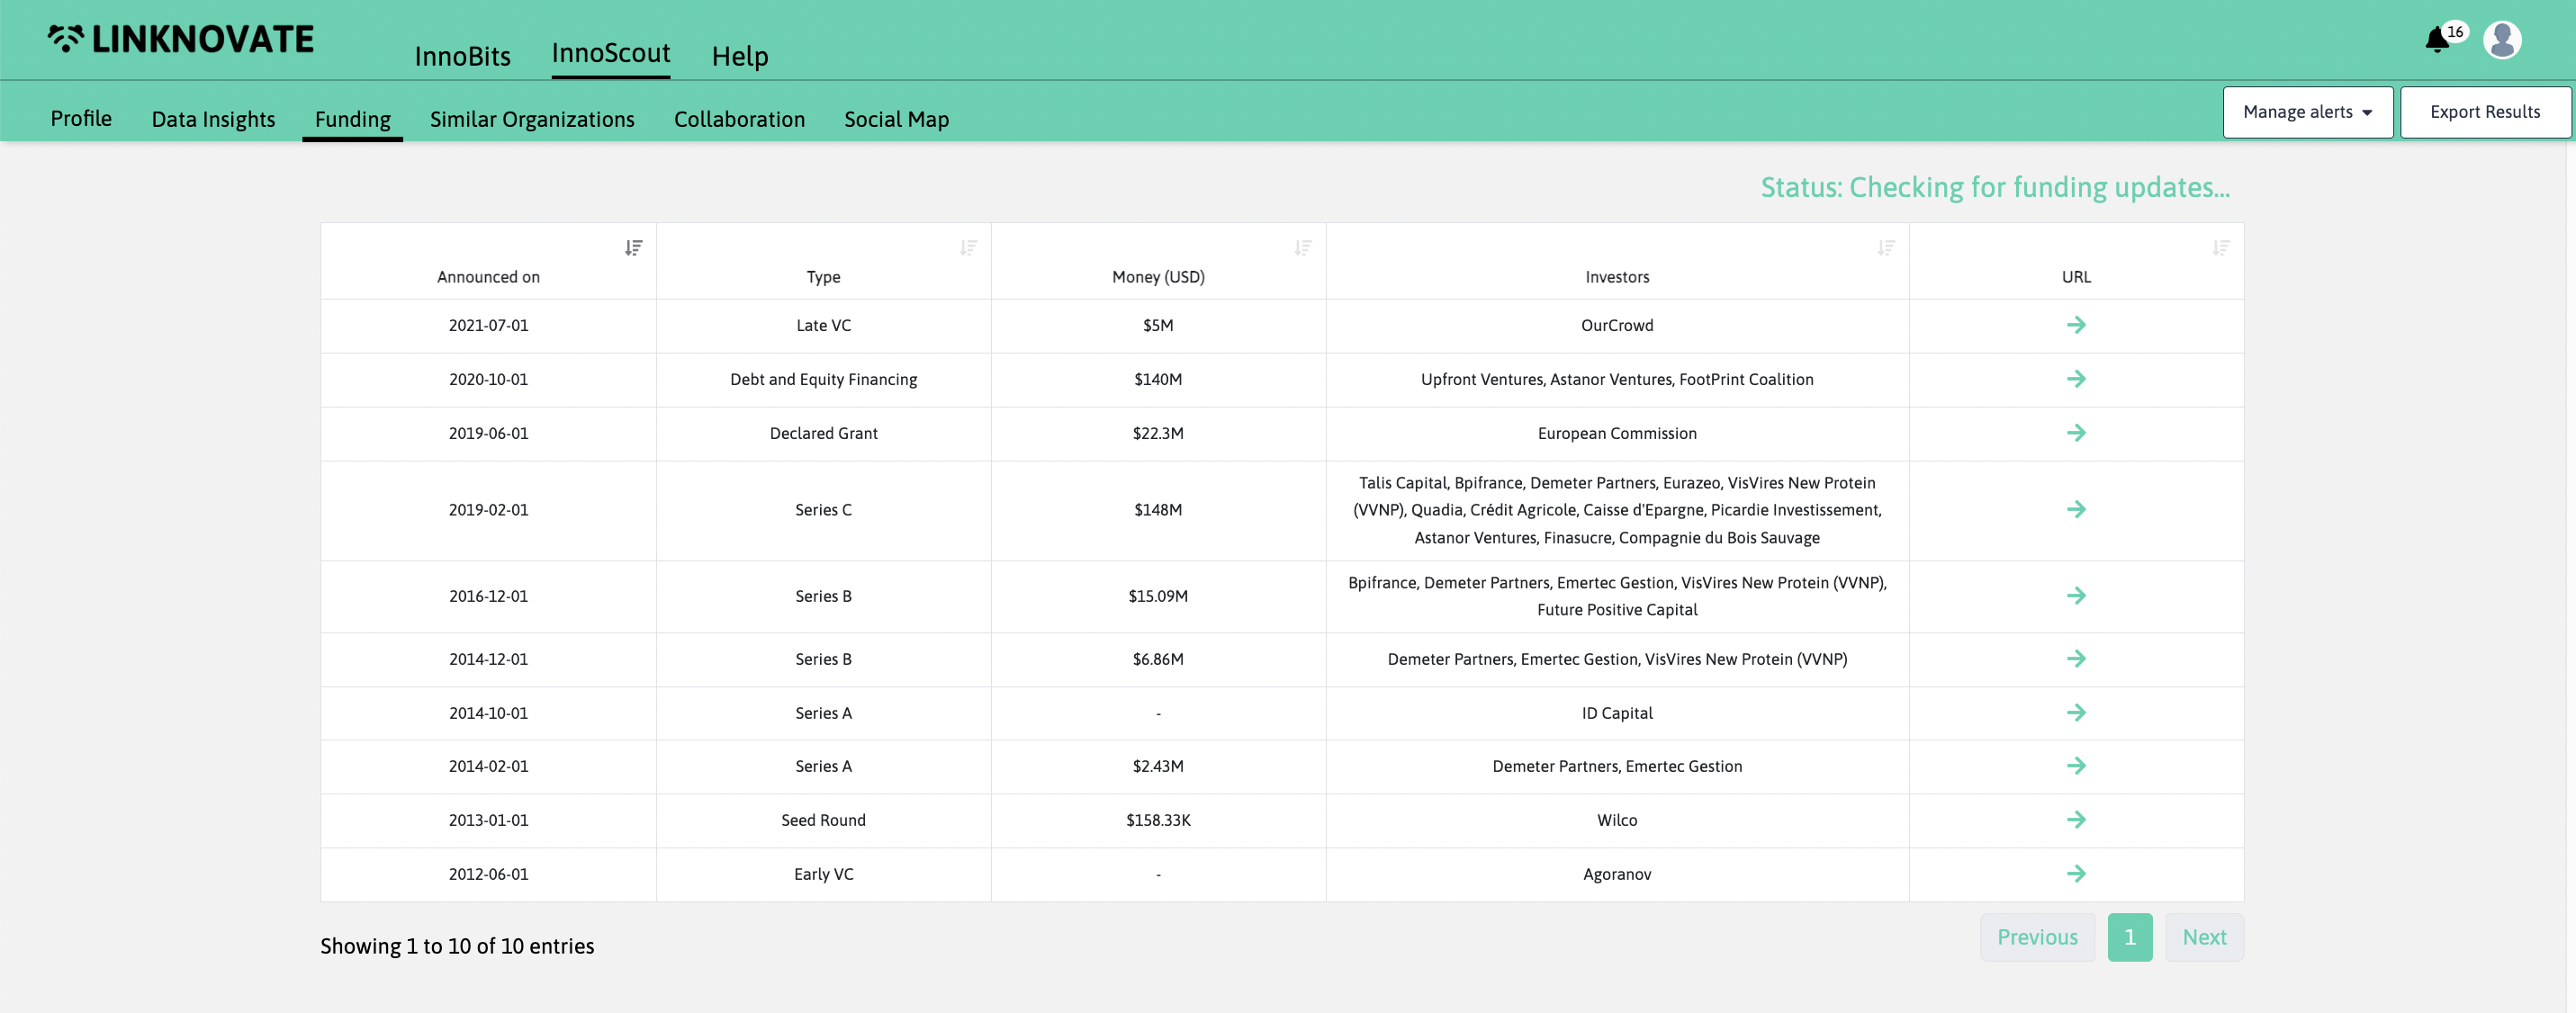
The funding section shows the funding rounds the organization went through (if any) and the investors linked to every round. It is possible to access the original source through the arrow that leads to the external link.
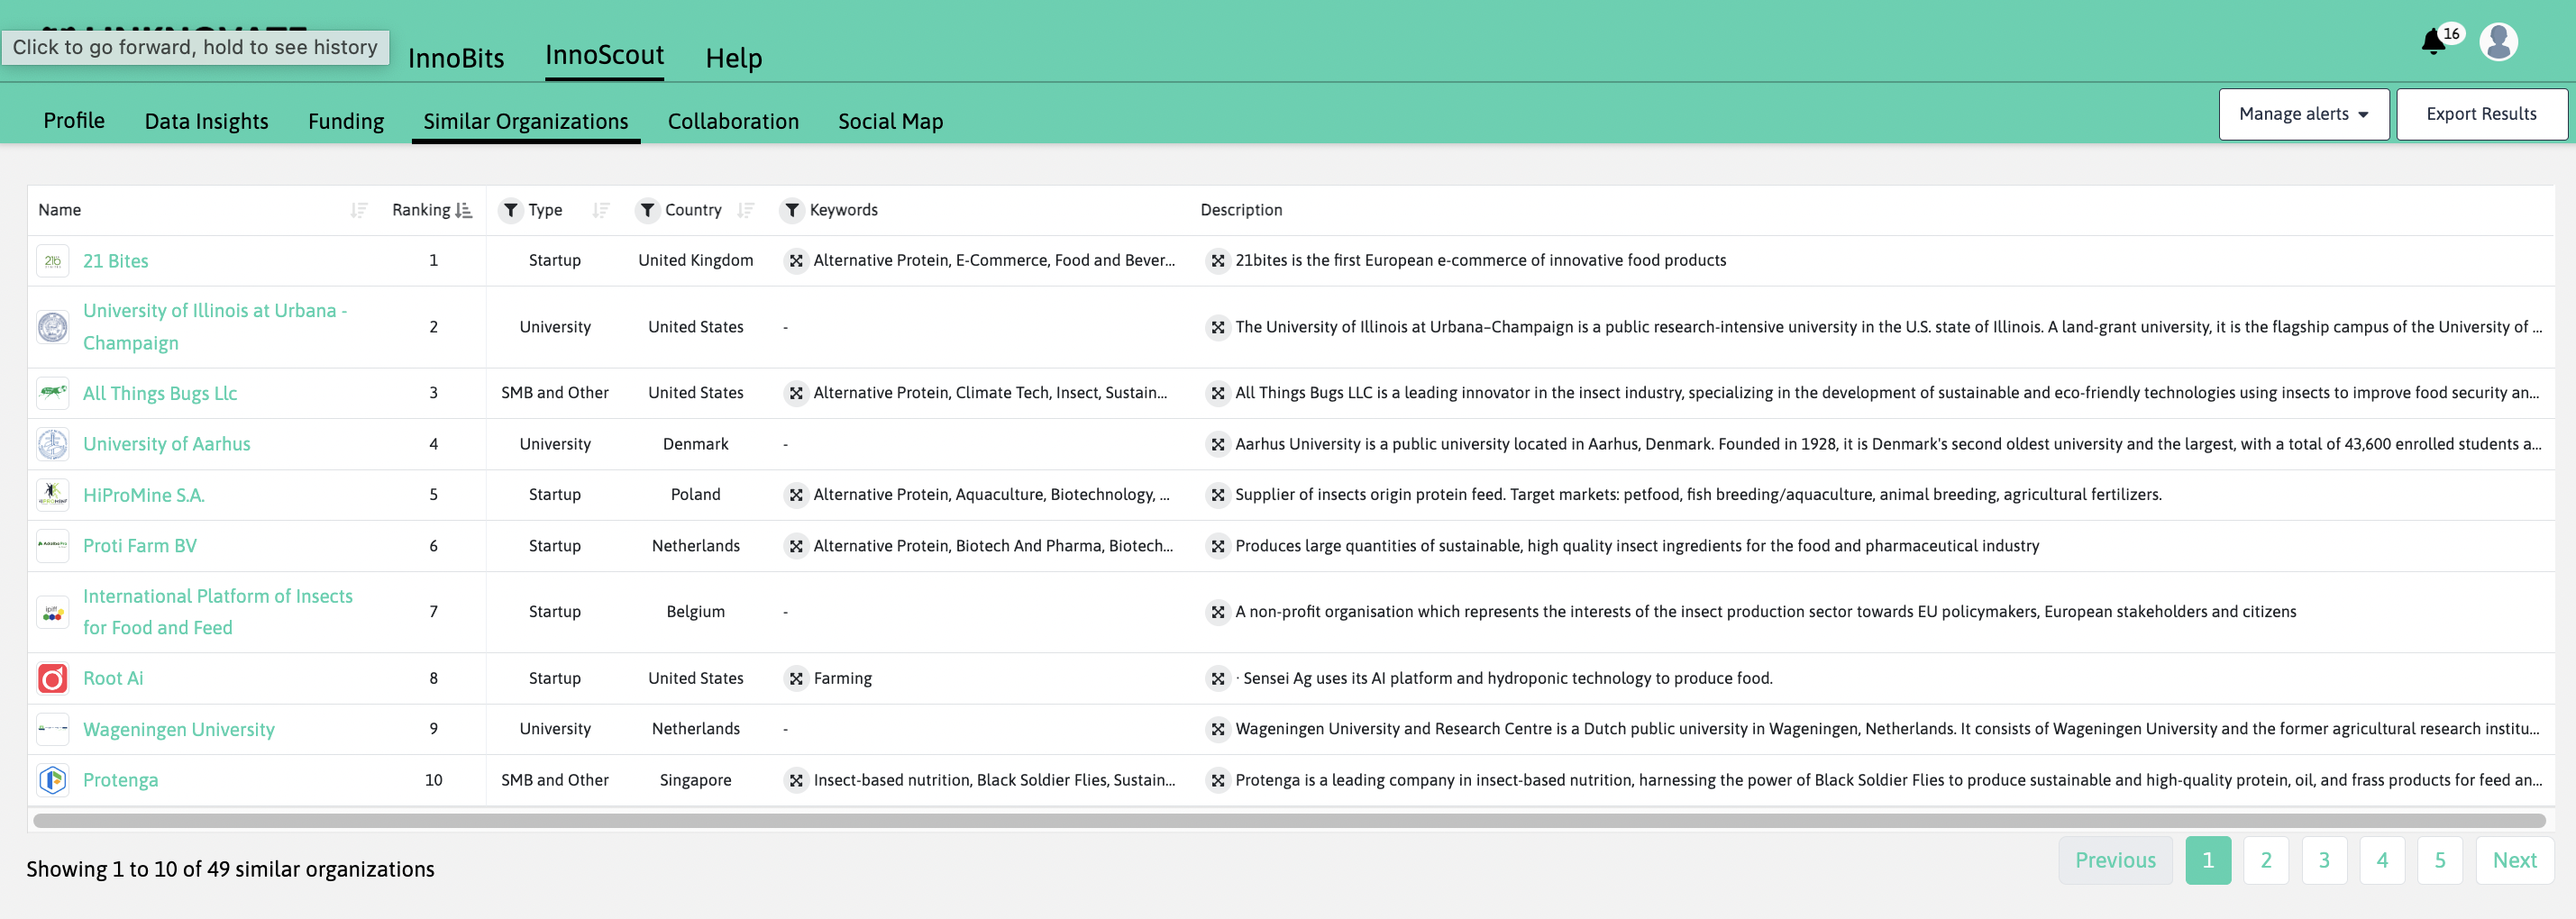
Clicking on “Similar Organizations”, the platform suggests companies that develop similar solutions and work in the same industry. This list can help you complete your competitors’ analysis, and give you more insights about the market or technology you are investigating. In the example, we are looking at similar companies of a b-corp developing insect-based proteins and products.
Linknovate wants to help you with your Competitor Research. We dramatically reduce your research time (through tons of websites and never-ending excel spreadsheets) by providing you with easy to use tools that allow you to know with whom and how an organization is collaborating with another. We put within your reach different graphs and visualizations that will allow you to tear down your competitor's strategies at a glance in a direct, easy way to understand. Simply make a search and head straight for our tools.
Go to the profile of the organization you are interested in and click on the Collaboration tab. There you will find the Collaboration's Table, which shows a list of organizations that are collaborating with your competitor, and in which topics. The list is sorted by defect by the number of documents they have in common but you can sort it by another criterion such as the type of organization, the organization's name, or even fields of research.
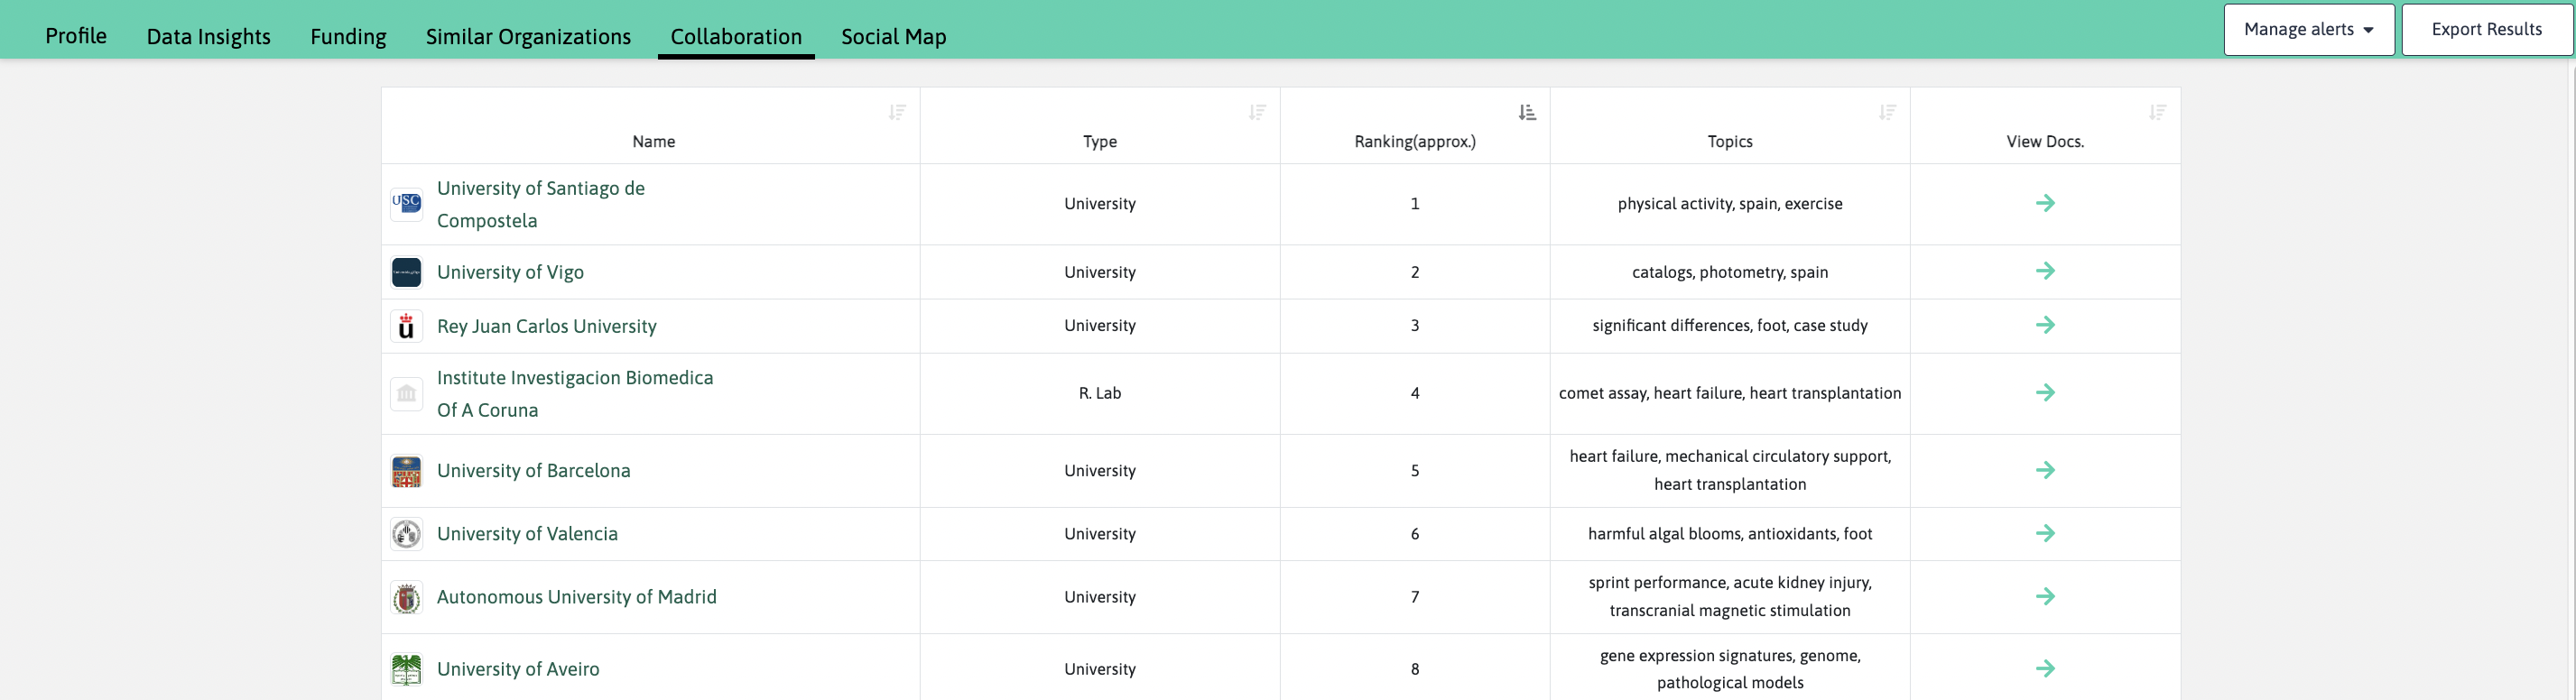
If you click on any of the entities listed, you will be redirected to their profile page. Besides, if you click on the number of documents, you will see all the documents both entities have in collaboration.
We want to help you look good and we know presentations are still the most used resource when presenting results to managers and colleagues.
Generate a report of your search and all the data analysis, performed in real-time and with just one-click
. You will have it in your inbox in 2 min.
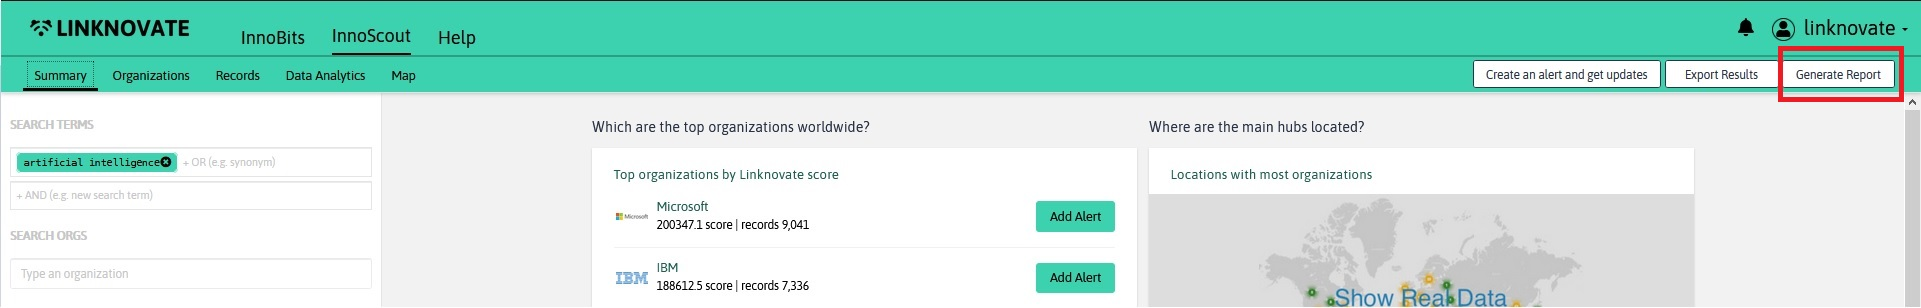
Generate Report> Select the companies/organizations you want in your report.
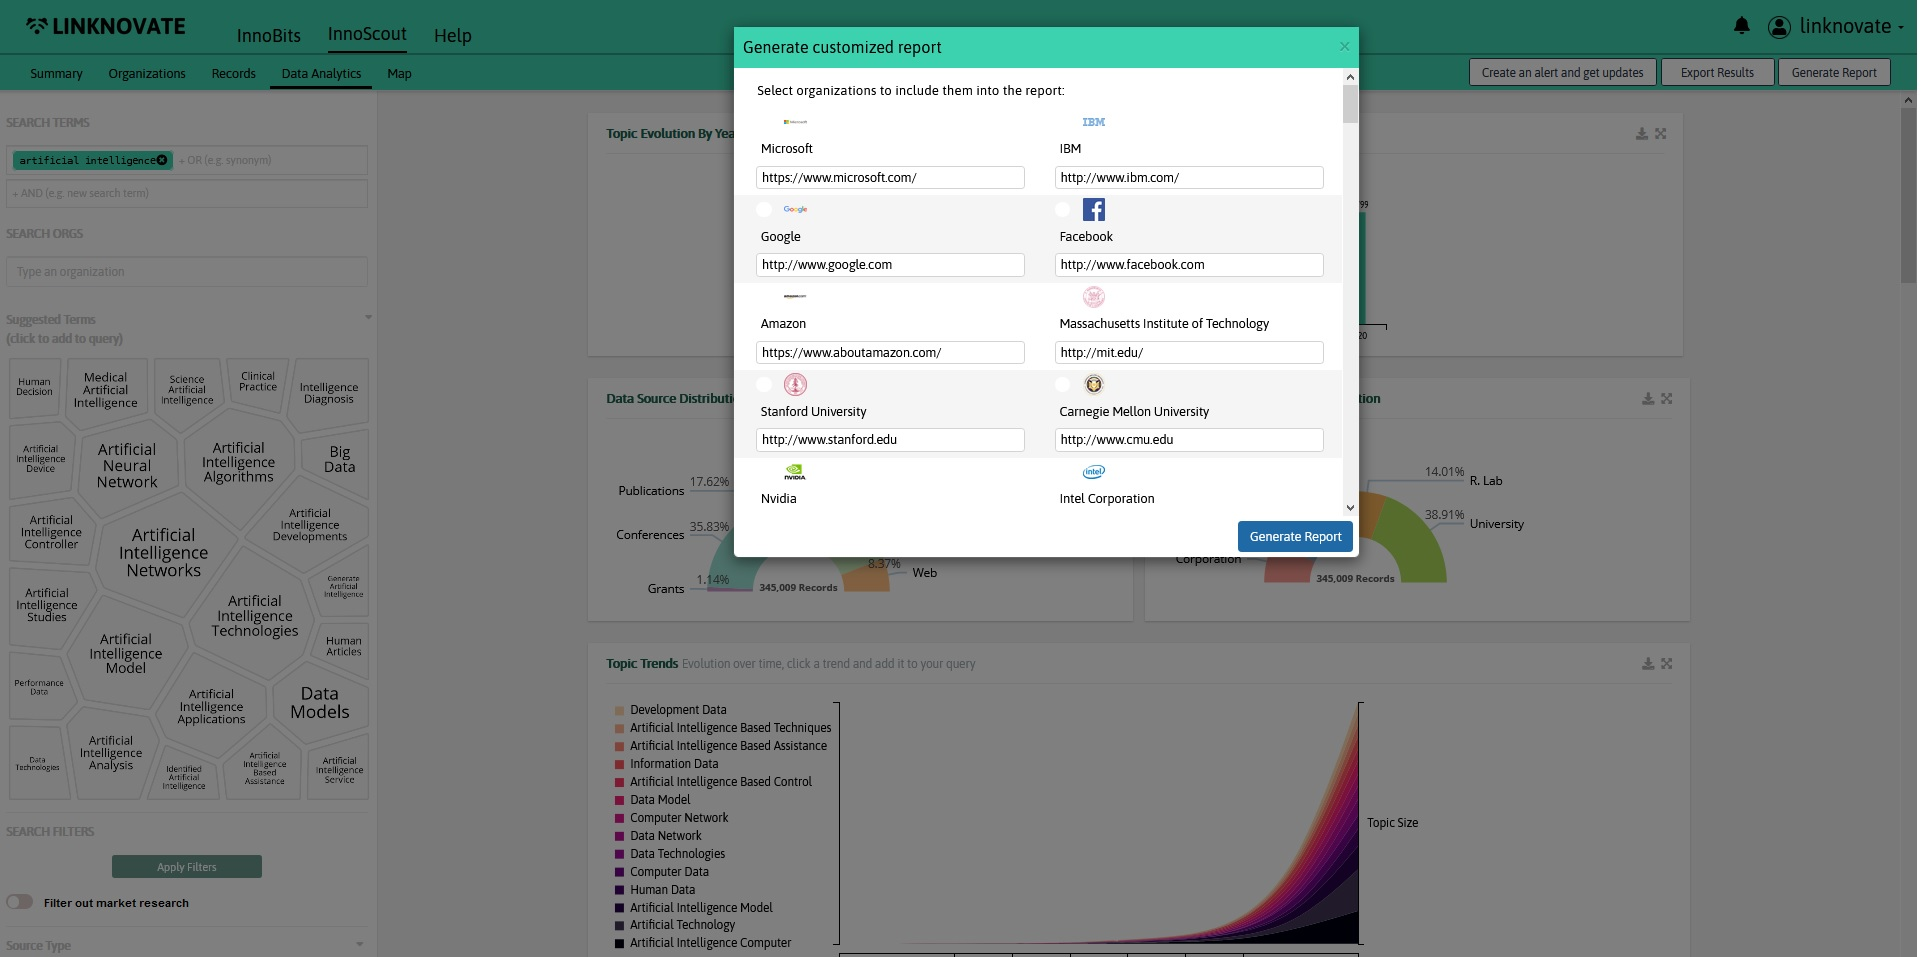
All the graphs will be in your report together with the profiles of the organizations you choose. The result is an elegant-designed presentation that includes screenshots of the companies and blue text boxes for your personal annotations and comments on each slide.
Someone is finaly helping to create cool reports in an instant. See a full example on the topic diabetes adherence to treatment
here.
At Linknovate we are building an ecosystem for science and engineering that makes it easy to identify and contact organizations with relevant technologies, products or services.
Our mission is to help innovators, scientists, and companies with new, cutting-edge technologies to be discovered by the ones in need of their knowledge & technology.
First, you need to check if your company is already identified in our database. Start typing your company in our search box. If we have it, it will appear as a suggested option.

If we have already indexed your company, you can Claim Your Profile. Go to your company’s profile page and claim it. We will contact you soon to verify your identity and give you access to enhance and update your company’s profile.

If we haven’t aggregated your company in Linknovate’s database, you still have the chance to create a brand-new profile.
Go to the Create Your Profile tab and click in the Create It Manually button. Fill the form, add your product/services and submit your company to start getting leads and visibility

We take care of making it visible to the ones searching in your field, you only need to update it with new products and techs to appear higher in our rankings.

Build your Profile is perfect for private companies (particularly small companies and startups) and research groups to market their capabilities. Departments that would benefit the most:
Innobits is our monitoring tool, a personalized alert system that keeps you engaged with innovation and allows you to lead collaborative research.
Once you log in Linknovate, the first page you see is your customized feed through InnoBits.
InnoBits works as a newsfeed where you can monitor your topics of interest: the page shows the most recents news and publications related to your saved alerts, and allows you to share, like, and tag them. The feed will allow you to keep a close eye on topics and organizations of your interest, and to receive personalized updates straight to your inbox whenever there is something new and relevant to the topic.
The InnoBits page is divided in three sections: the updates (or records) in the main section of the page, the alerts on the left (or filters), and the suggestions on the right.
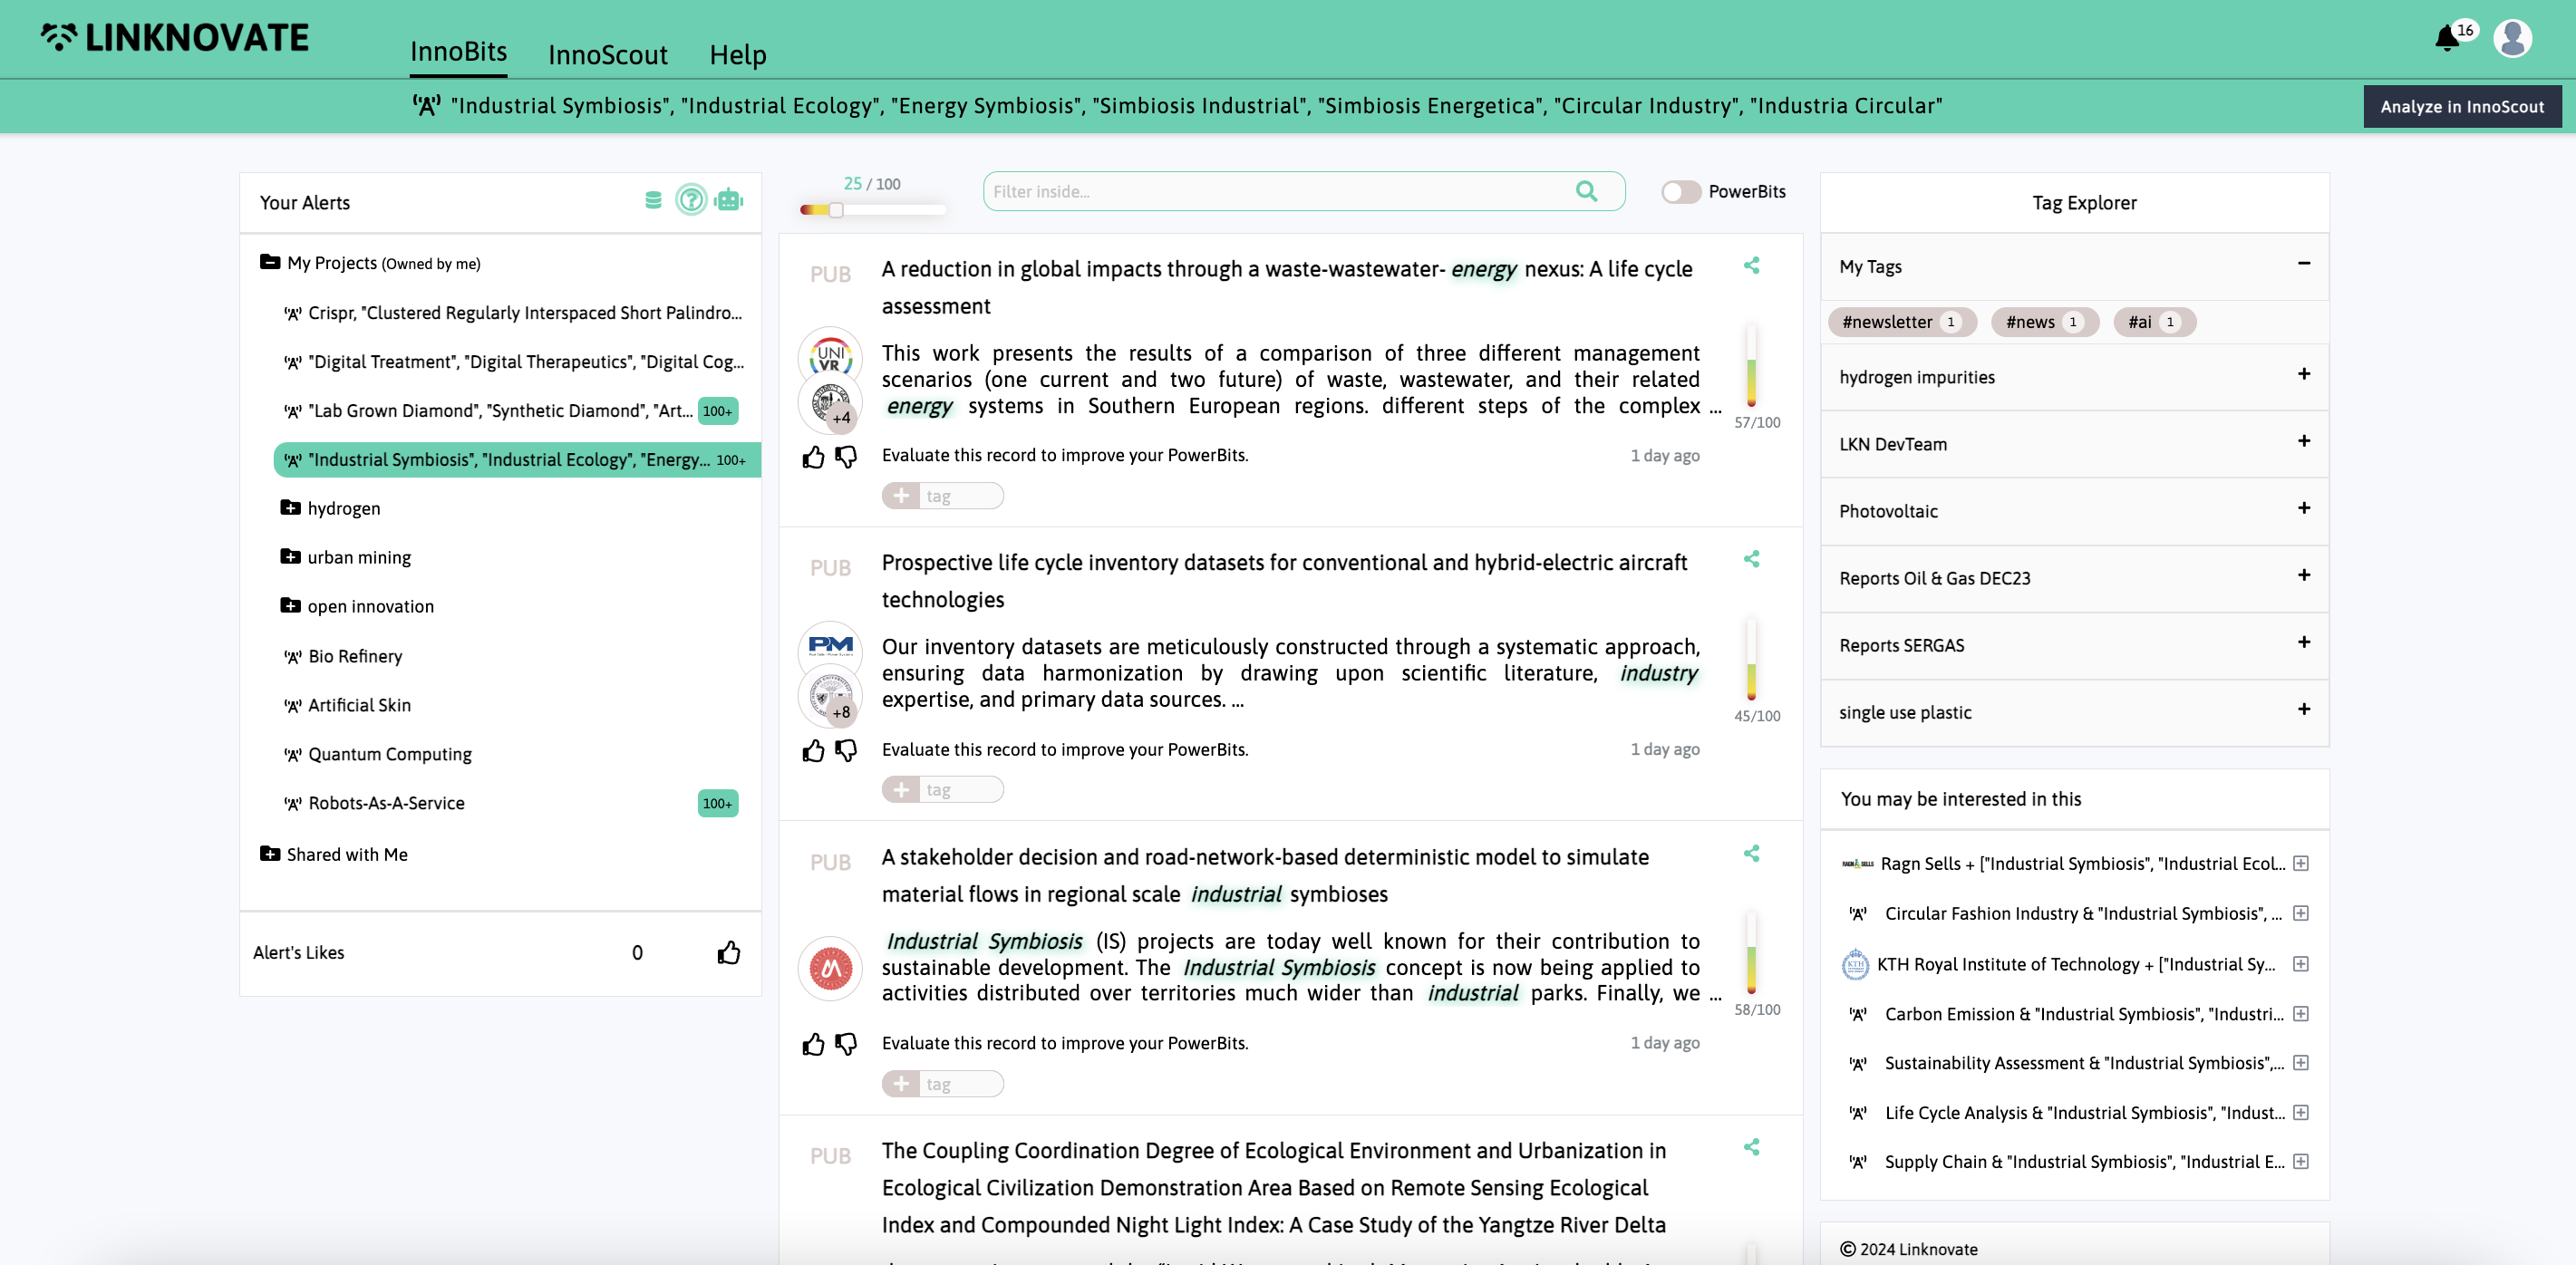
In the central section or column, the feed, you can see the newest updates on the specific topic or organization you have selected.
The top blue bar will remind you which topic/organization's updates you are looking at. Also, they will appear in blue in the alerts section on the left column.
The updates are ranked by date, from the newest or most recent to the latest. For each of them you will see the following information:
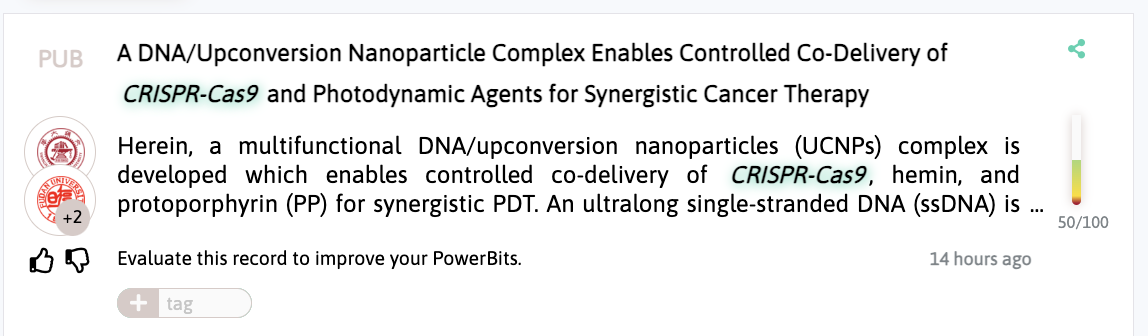
You can also add the records that you find most relevant to Your Favorites
list, by simply clicking on the thumbs up symbol ().After you evaluate a few records, the function “Power Bits” will be unlocked. Through this option, the system will learn your preferences and personalize the docs to show you.

Next filter option is Relevance, which is set by default at 25/100. How does our algorithm assess whether a record is relevant? It takes into account different aspects such as the recency, the type, or the topic of the document to allocate it a score out of 100. Filtering the relevance by 25/100 will show in the feed all the updates with a minimum of 25 score. Remember you can access the feed for all your favorite records (regardless of their topic or organization) by clicking on the number or the thumbs up () in the Your Favorites section.
As just mentioned, after the user evaluated a few records using the like and dislike buttons, they can turn the “PowerBits” option on: in this way, the system will learn and personalize the docs to show in the feed section based on their preferences.
You can filter the feed simply by inserting keywords in the search bar above the feed.
When you first sign up on Linknovate, we will ask you to enter some topics and organizations of your interest. You will see them in the left section Your Alerts of InnoBits. To make sure you don’t miss anything, we will also send you personalized alerts straight to your inbox whenever there is something new and relevant in a topic or organization you are following.
The alerts' section acts as filters, so you can consult all your alert's feeds separately.
By default, each user starts with two folders (which are not removable):

By default, we will show you the feed for the first alert. To check another alerts' feed, simply click on any of them. It will automatically turn green and the feed will change to meet the criteria.
If you want to add new alerts (topics or organizations to monitor) or new folders, use the buttons located near each folder ( ) in which you have editing permissions.
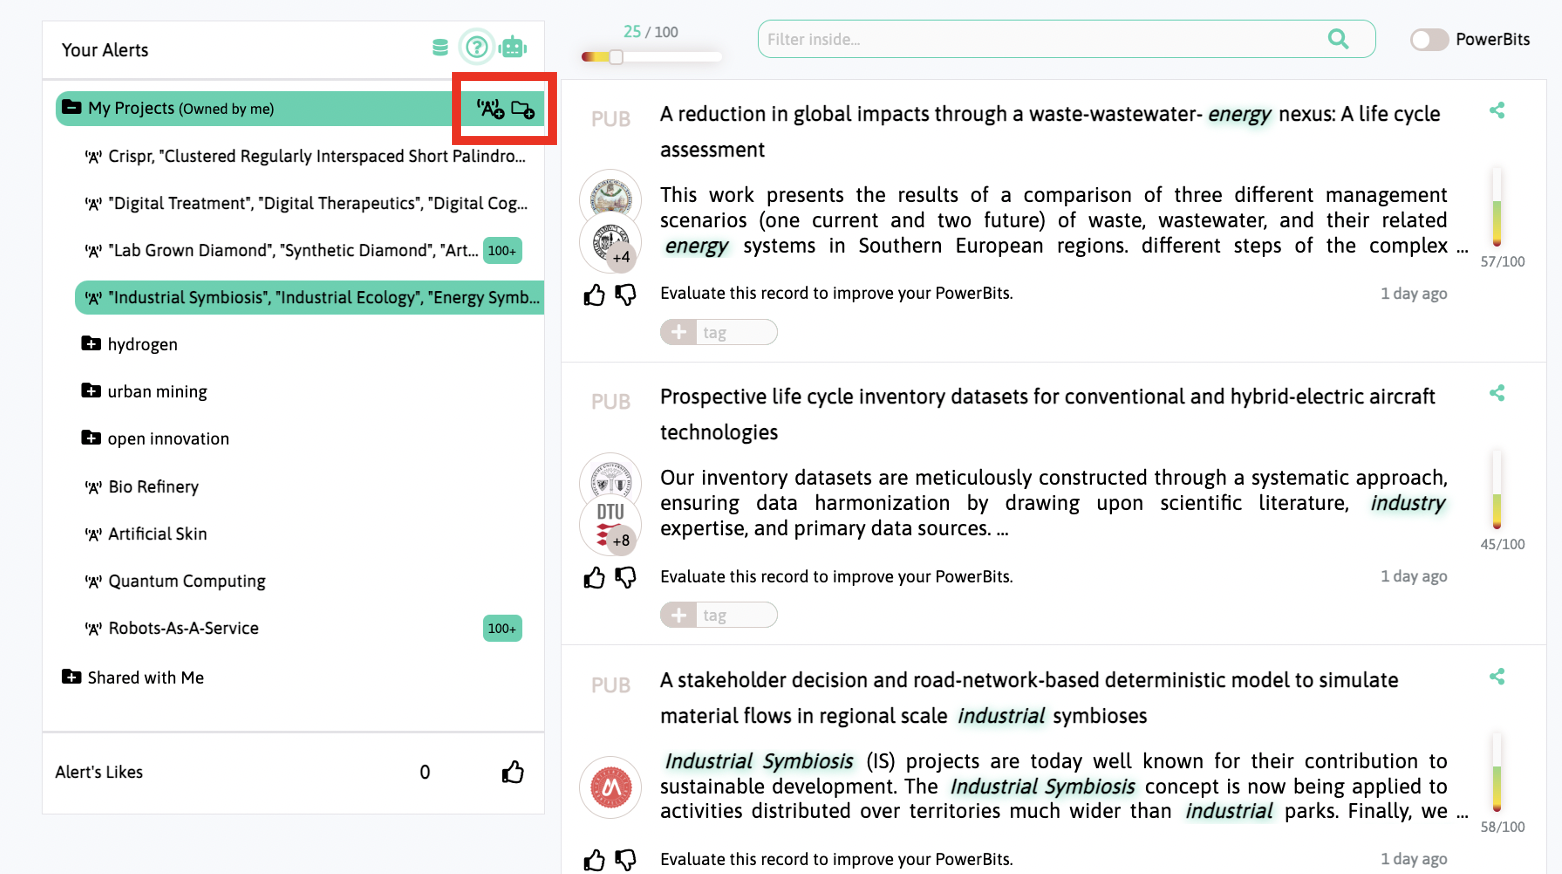
Clicking “New Alert”, a modal will appear where you can type new topics or organizations to follow, and we will also suggest similar ones. Once the process is finished, the new alert will appear inside the chosen folder.
If you want to create a new folder, the process is very similar. If you want to organize your searches better, you can create new folders by clicking the button “New Folder” ( ) located near “My Projects” or near any folder within which you want the new folder to appear. Once the process is finished, the new folder will appear inside the chosen project.
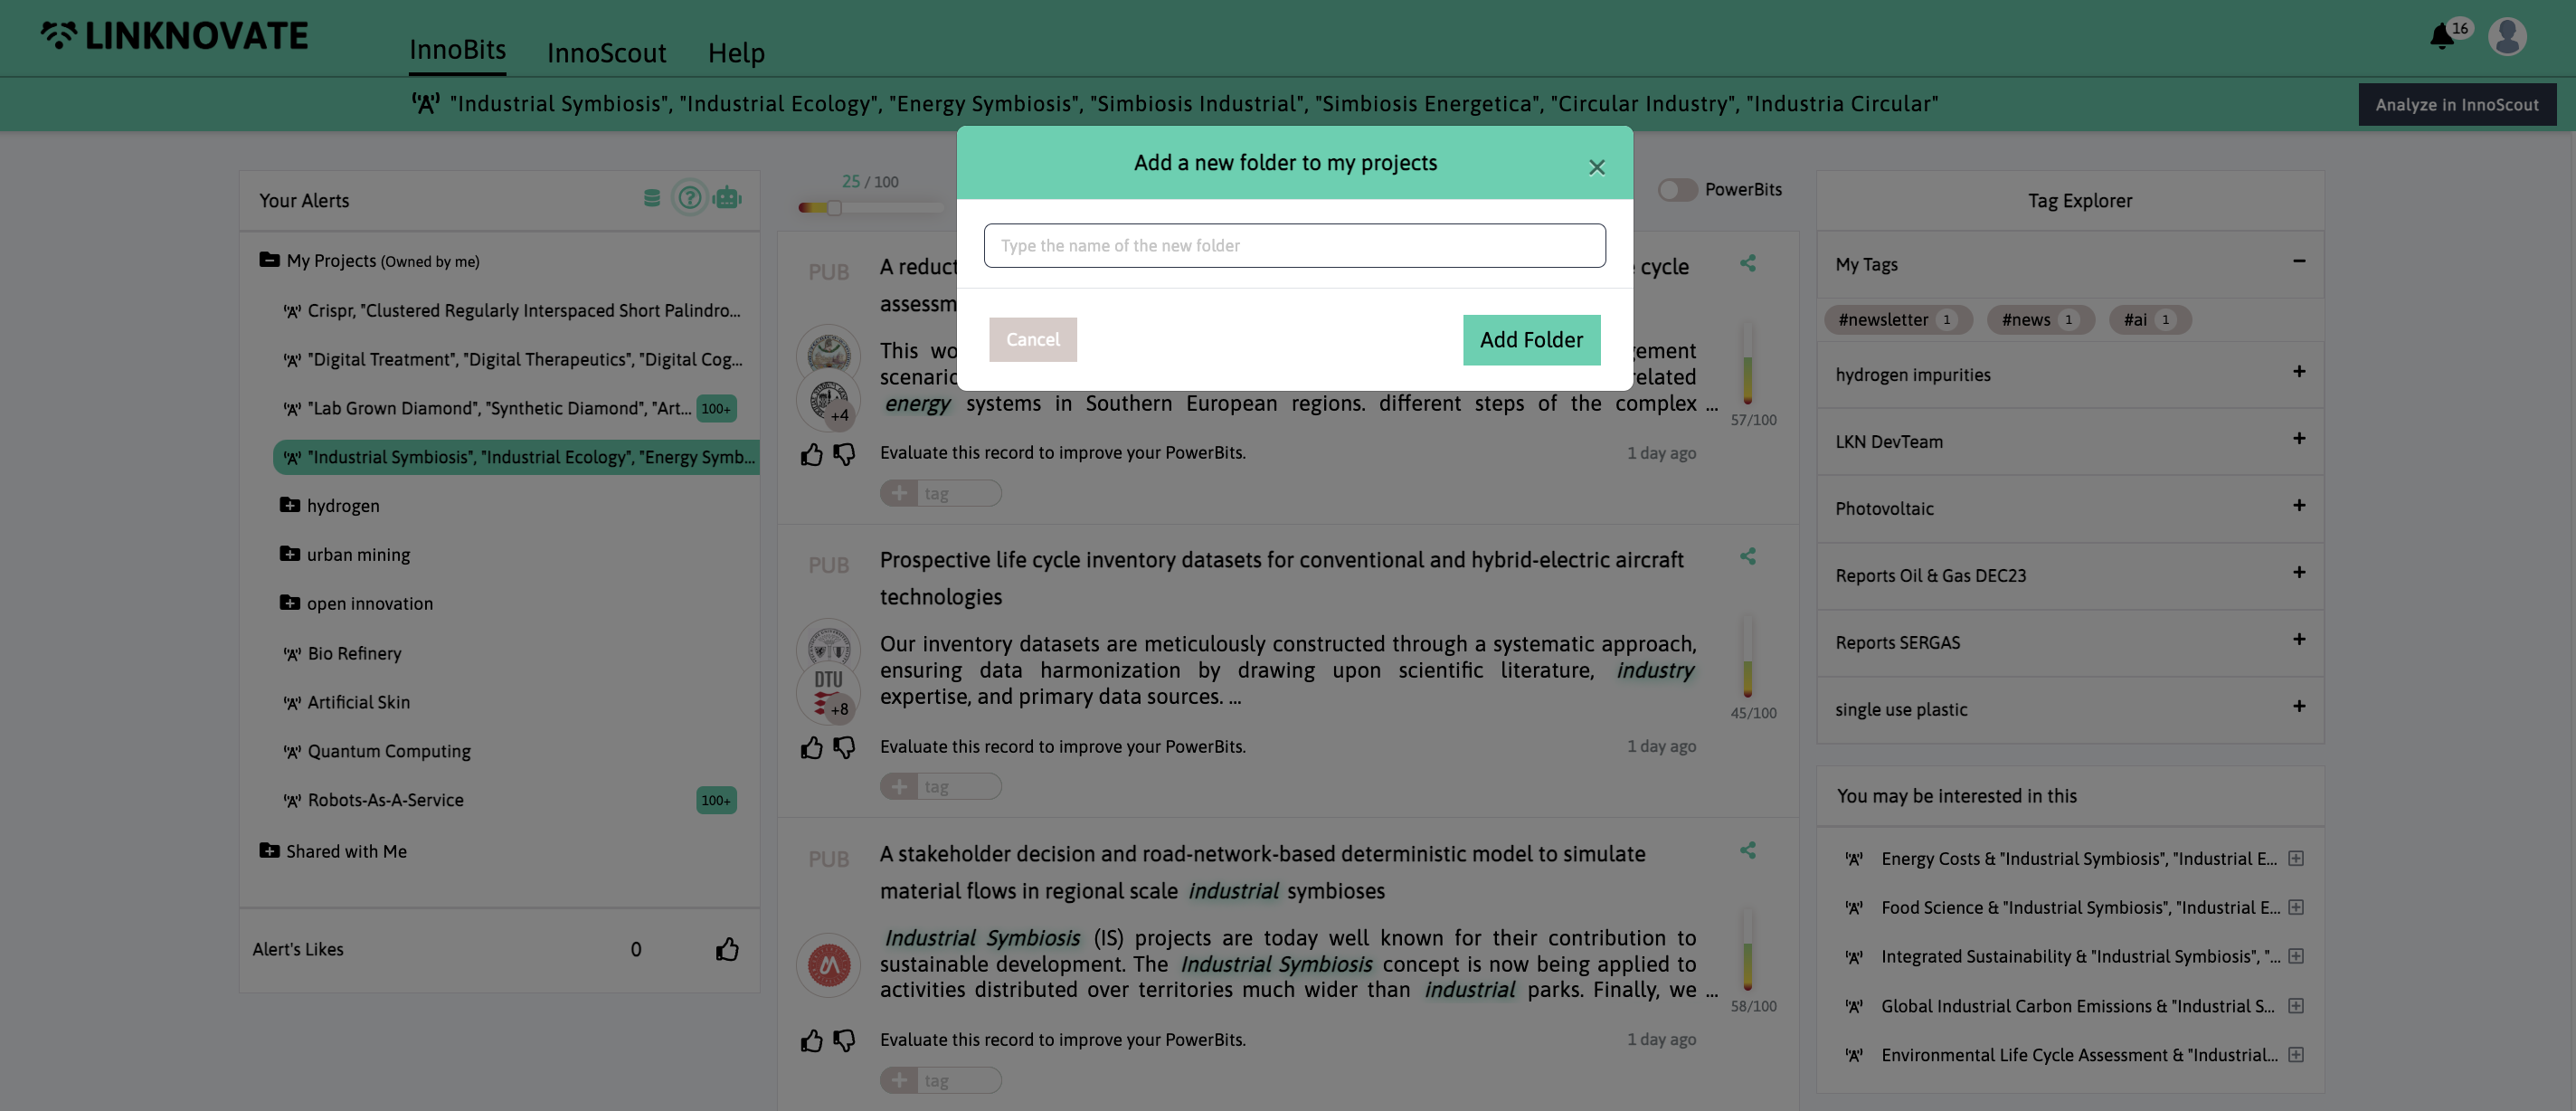
Once a new folder is created, you can delete it, change it, move it, add new searches to it, and share it with your team through the buttons ( ) you will find at its side.
If you want to stop following a query or organization, you can do so by clicking on the button. You can edit any of your alerts by clicking on the button. Both of these buttons will appear near to each alert you can edit.
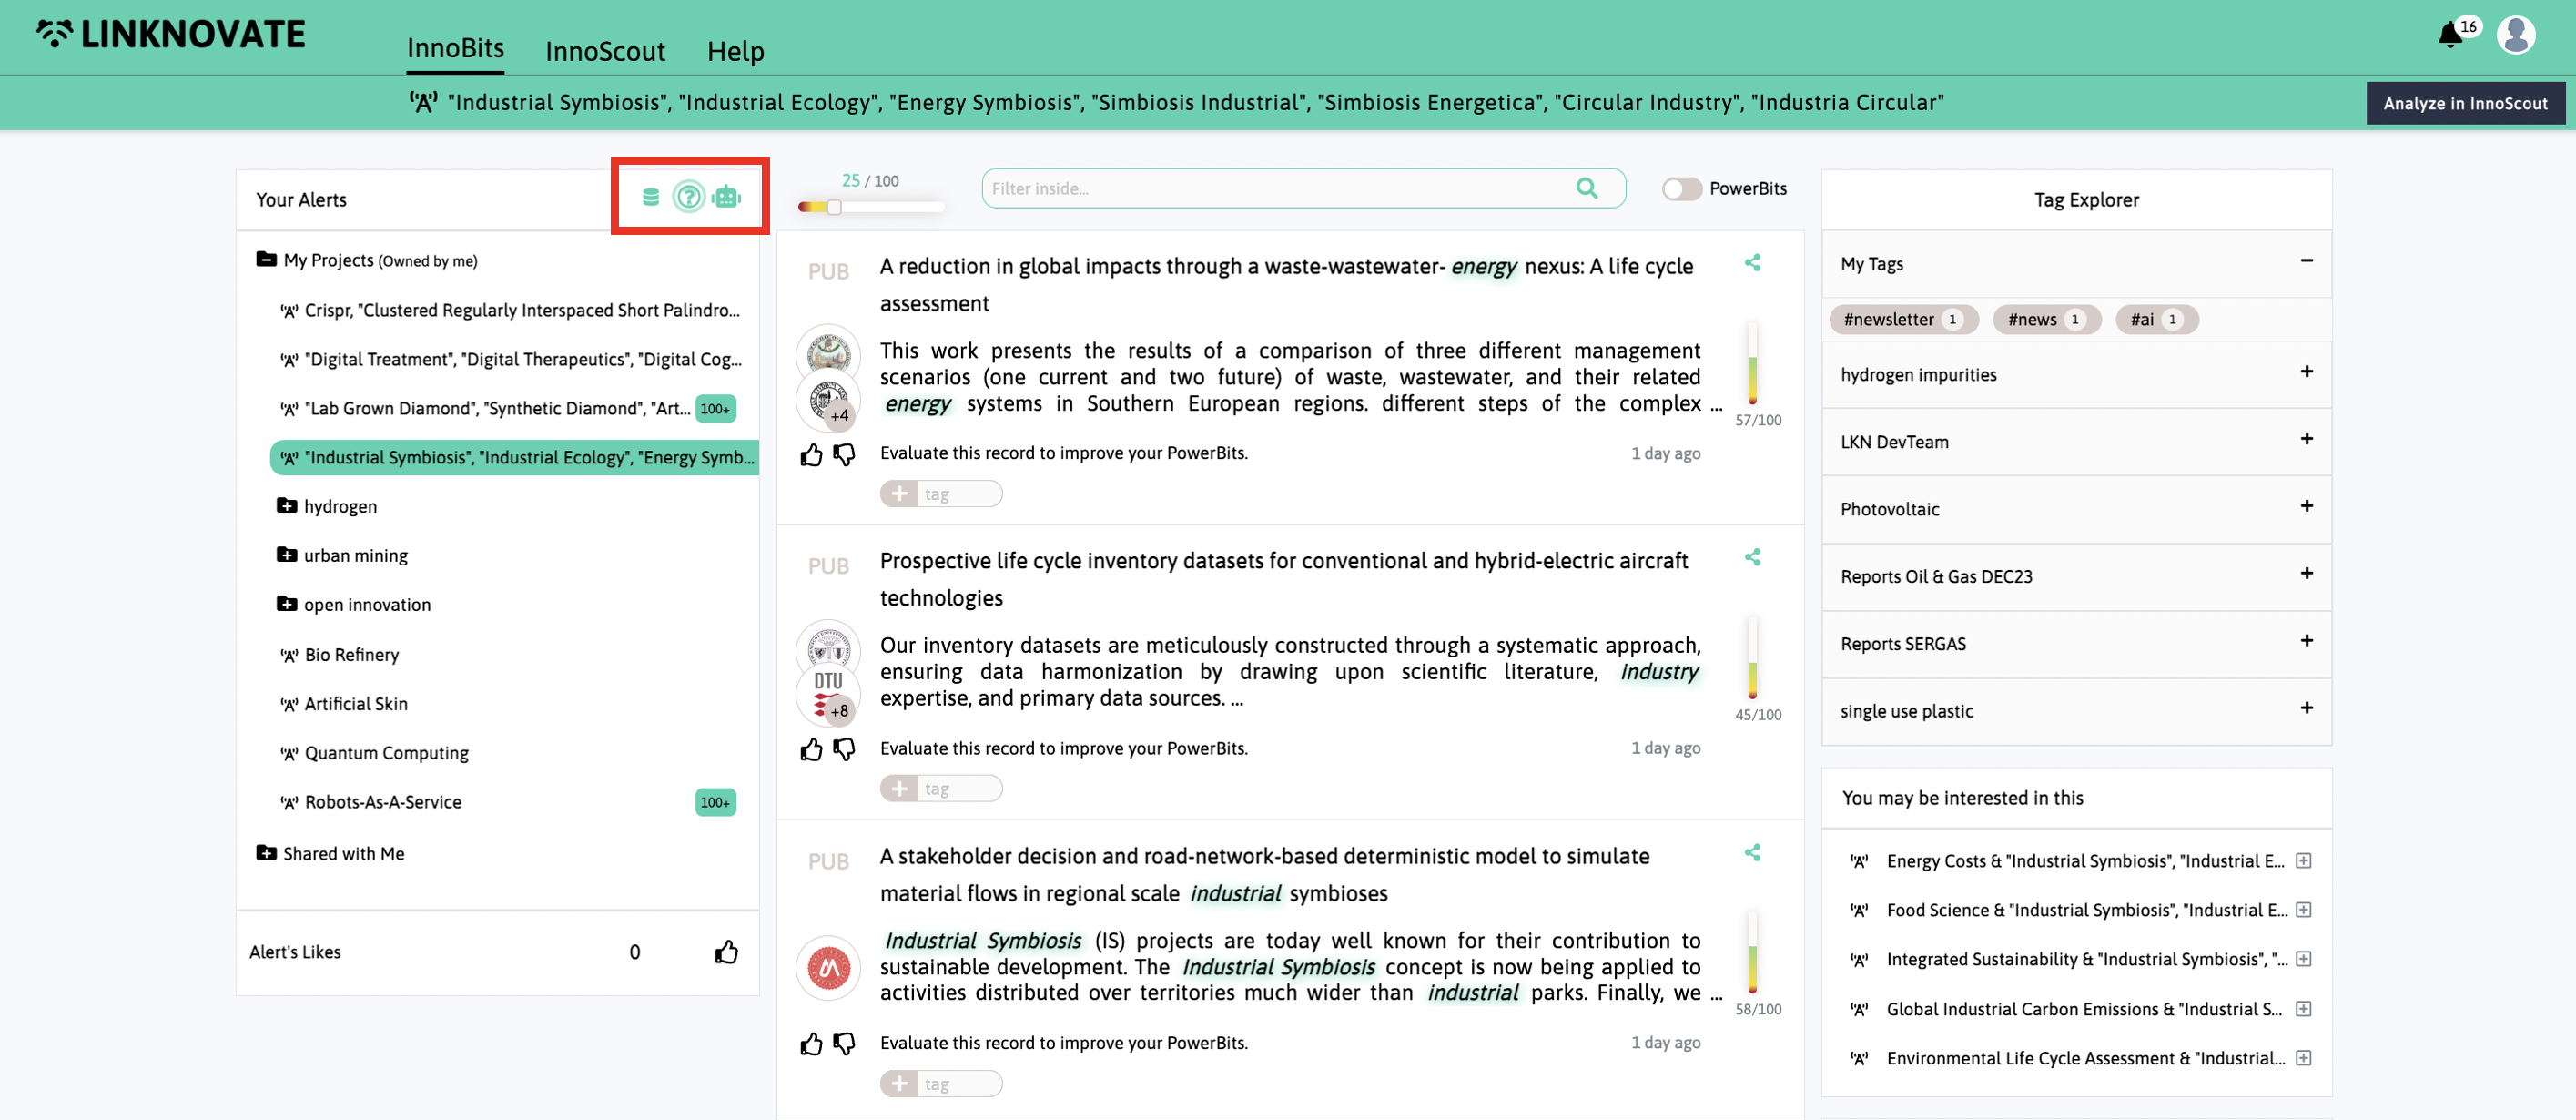
Next to “Your Alerts”, you will find three buttons:
Clicking the ( ) button, you will be able to add the RSS link of some website of your interest, or the url of some news you find interesting but didn’t find in your feed. In this way, you can add to the platform your favorite news sources.
The help button will show you information related to the feature of InnoBits and help you quickly solve any doubt you may have related to it.
The robot will show you AI-powered suggestions based on your searches and preferences.
Another way to organize and navigate your feed is to add tags to the records. You can do it simply using the “+tag” option shown below each record and add any keyword of your choice to label the source. You can find all your tags and those of your team on the right side of the page, and explore all the records within them simply by clicking on the hashtag of your interest.
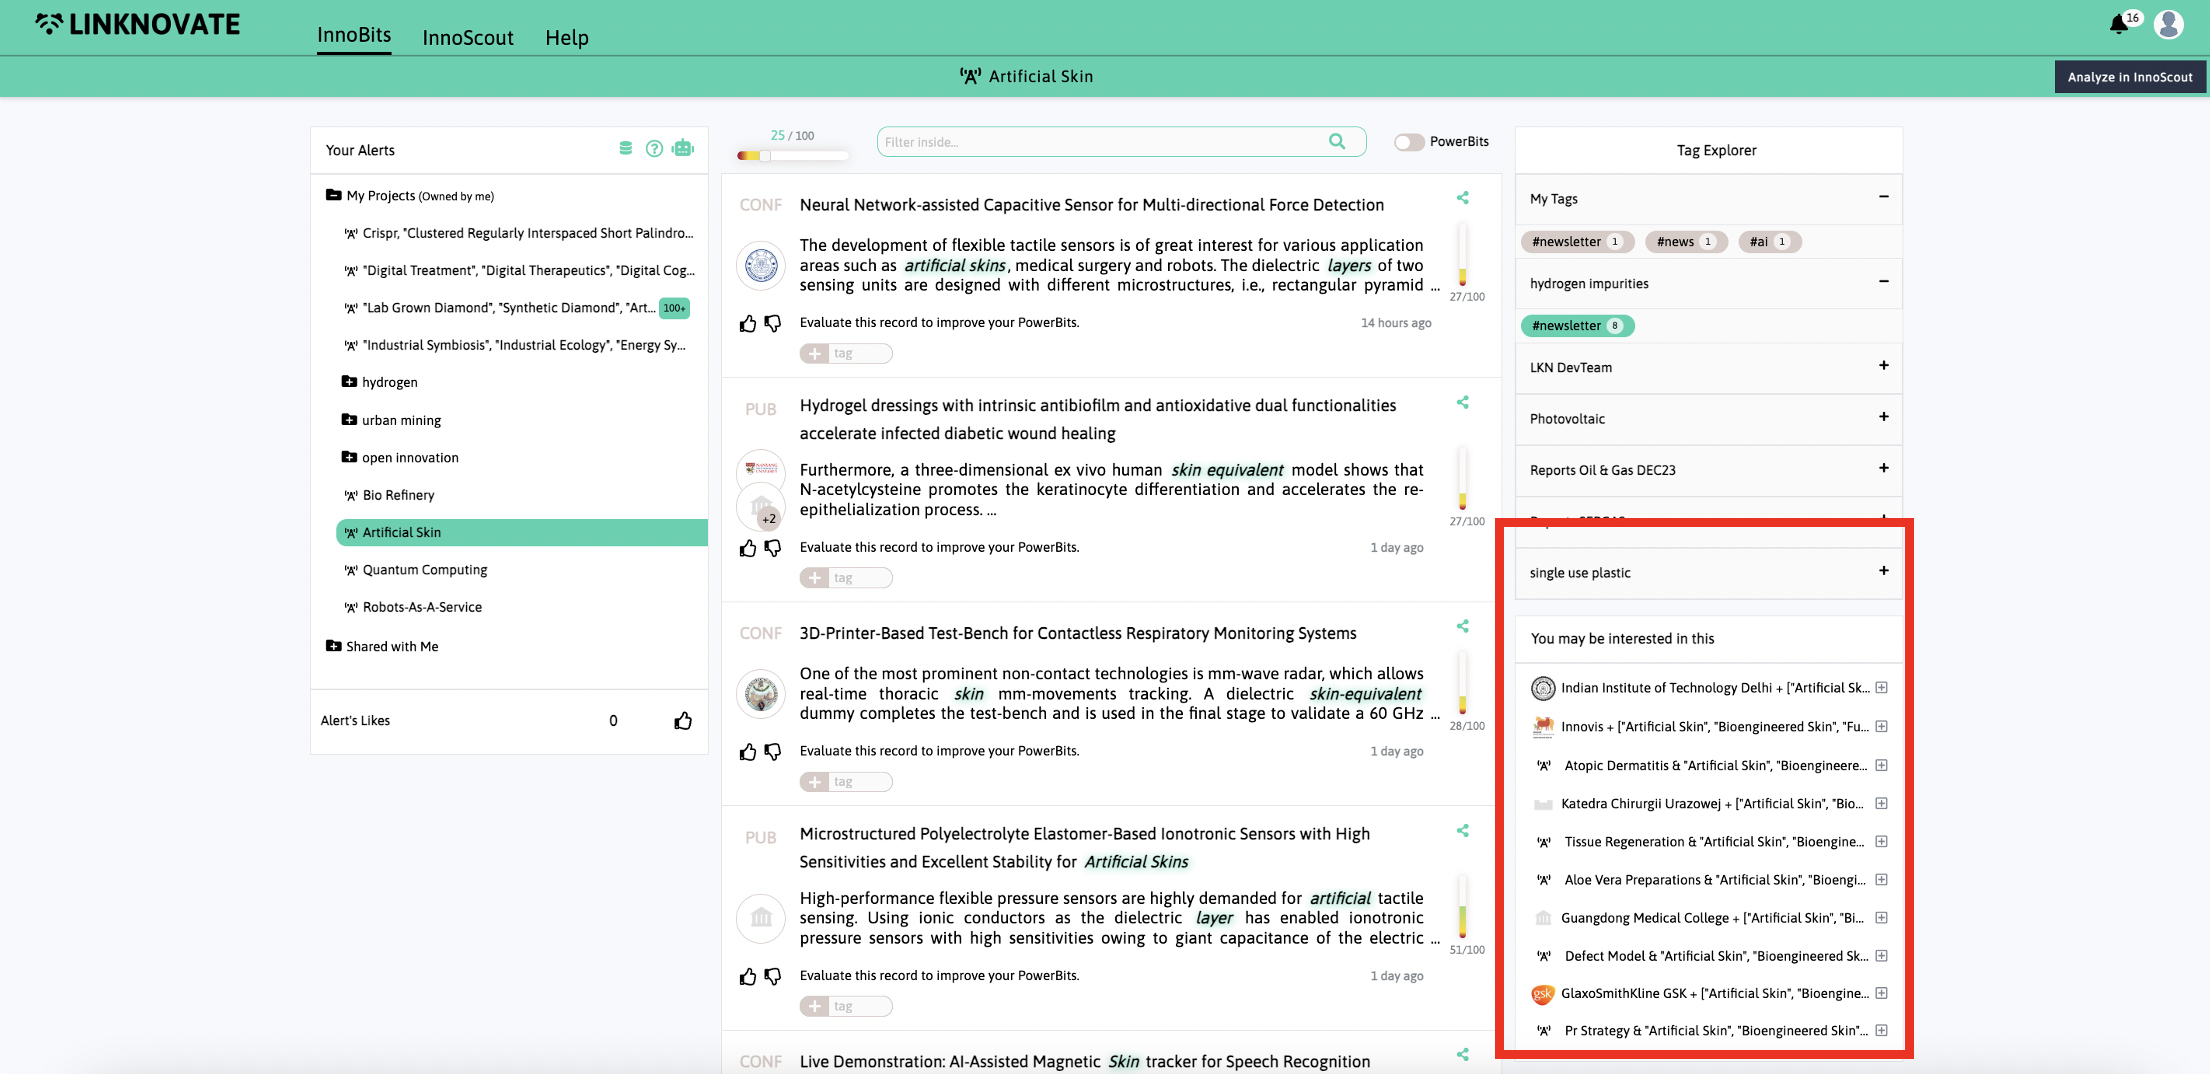
Finally, in the section on the right-hand side of the page, you will be able to see suggested topics and organizations based on the alerts and topics you are following.
Click over the suggestion name to run a search or access the entity profile and click on the add ( ) button to add it to your alerts.
Social Map.
One more way of knowing your competitor's collaboration strategy is using the Social Map we provide. You will find it within the Entity's Profile top menu, in the Social Map tab. This is a great way of knowing whether your competitor’s strategy is focused in a specific geographical area or if they are betting internationally.
For each organization your competitor is collaborating with, the social map shows you the number of works they have in common and any other companies that may be associated.